Visual Diagnosability in Tellinidae (Mollusca: Bivalvia: Tellinoidea): Genus-First CNN Routing Improves Species-Level Shell Identification
Published on: May 2026
Abstract
Tellinidae (Mollusca: Bivalvia: Tellinoidea) is a species-rich and taxonomically challenging family of heterodont bivalves in which shell morphology remains important for identification, but is also affected by functional adaptation, convergence, and unresolved systematic relationships. This report evaluates whether image-based convolutional neural network classification of Tellinidae shells is better organized as a direct flat Family→Species task or as a genus-first Family→Genus→Species hierarchy. Two flat species-level models and two genus-router models were compared with a strict 41-species hierarchy and an extended 55-species genus-first framework. In the strict 41-species comparison, the hierarchical route clearly outperformed the flat species model, reaching 92.24% species-level accuracy compared with 82.18%. The advantage remained when the stricter hierarchy was compared with the stronger extended flat model on the shared 41-species subset, where the hierarchy reached 93.97% accuracy versus 88.11% for the extended flat classifier. This improvement was possible because genus routing was highly reliable, reaching 99.17% and 98.86% on the two paired replay sets, so routing errors rarely prevented the correct downstream specialist from being used.
The results show that genus-first routing is operationally useful for multi-species Tellinidae genera, but also that the benefit is not uniform. Several Genus→Species specialists, including Ameritella, Arcopagia, Pharaonella, Scutarcopagia, and Ardeamya, showed high species-level recoverability after genus-level restriction. In contrast, Macoma, Gastrana, Strigilla, Eurytellina, and Tellinella remained specialist-stage bottlenecks, indicating that some species boundaries are weakly recoverable from the current shell-image representation alone. The extended 55-species flat model remained important for broader taxonomic coverage, reaching 90.23% accuracy across 55 species, but the extended genus-first route should be interpreted as a mixed operational strategy because several added genera were represented by only one eligible species in the current dataset. Overall, the study supports CNN performance as a morphology-based benchmark of visual diagnosability rather than as a phylogenetic test. Strong performance indicates visually coherent shell-image labels, whereas weak or uneven performance identifies taxa requiring further image curation, diagnostic-view expansion, confidence-aware deployment, and, where appropriate, anatomical, morphometric, geographic, or molecular validation.
Introduction
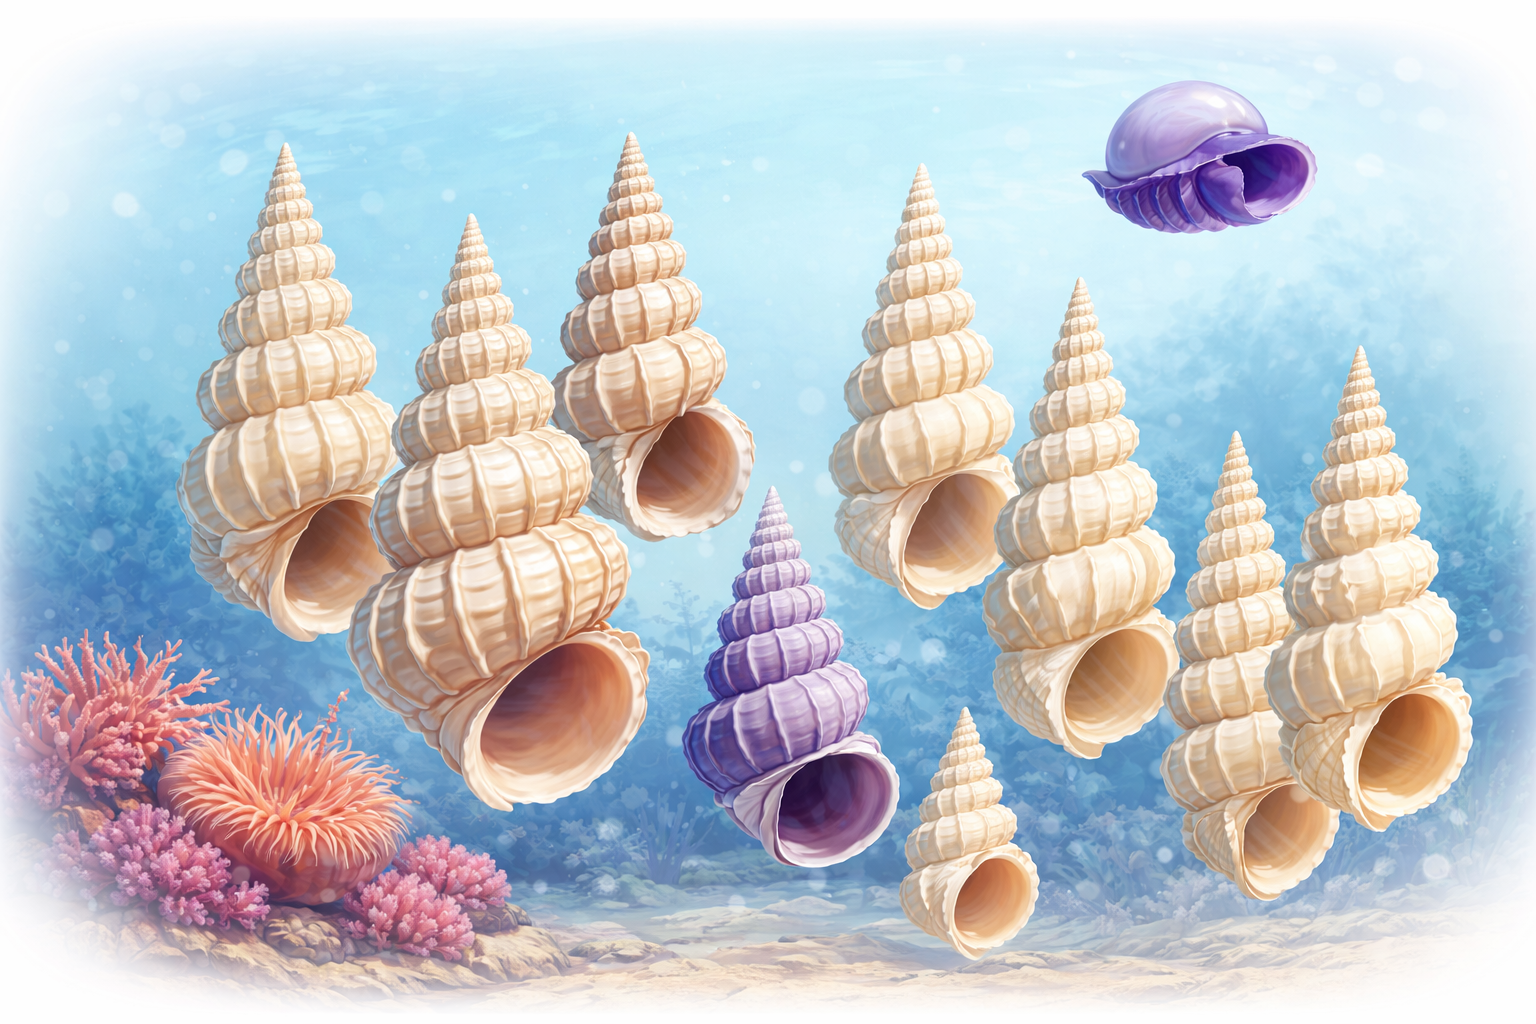
The family Tellinidae Blainville, 1814 comprises a diverse lineage of marine and brackish-water heterodont bivalves within Tellinoidea [1, 2]. Commonly known as tellins or sunset clams, tellinids are primarily soft-sediment infaunal bivalves and occur across a wide range of marine environments, from intertidal and shallow subtidal habitats to deeper shelf and bathyal settings [4, 5, 1] Recent database-based summaries recognize more than 500 living species and over 100 genera, although exact numbers vary depending on taxonomic treatment, synonymy, and the circumscription of historically broad genera such as Tellina sensu lato [4, 1]. The family is therefore both species-rich and taxonomically challenging, making it a relevant test case for image-based species identification. The two literature syntheses used for this report emphasize that Tellinidae combines high diversity, broad geographic distribution, ecological importance, and continuing taxonomic instability [3, 6].
Tellinids are morphologically well suited to shell-based recognition, but not necessarily simple to identify at species level. The shell is typically compressed, equivalve, and often marked by a posterior flexure, while hinge dentition, lateral teeth, sculpture, pallial sinus shape, shell outline, and posterior angulation are all used in diagnosis. [3, 4, 5]. These features are not merely descriptive; they are related to the animal’s infaunal life habit, position in the sediment, and use of long, mobile siphons for feeding at or near the sediment-water interface [4, 7, 8, 9]. Classical functional work on Tellinacea, especially by Yonge (1949) [4], interpreted these characters as part of an integrated deposit-feeding and burrowing system, while later ecological studies of Tellina tenuis, Macoma/Limecola balthica, and Macomona liliana showed that feeding mode, burrowing depth, predation risk, sediment properties, and physiological condition are tightly linked [10, 11, 12, 13, 14, 16]. Thus, the shell morphology available to a CNN is biologically meaningful, but it is also shaped by ecology and function rather than by phylogeny alone.
This point is central to the present modelling problem. Tellinid classification has historically relied strongly on shell characters, but recent molecular and phylogenomic studies have shown that some traditional shell-based groupings do not correspond cleanly to evolutionary history [17, 9, 6]. The broad distinction between Tellininae and Macominae, formerly based in part on the presence or absence of lateral hinge teeth, has been challenged by molecular evidence; recent mitogenomic work recovered Tellinoidea as monophyletic but classical Tellinidae as paraphyletic, with Semelidae nested within Tellinidae and traditional Macominae and Tellininae both polyphyletic [6]. Ultraconserved-element phylogenomics has further reinforced this instability by recovering Donacidae as monophyletic, but Tellinidae, Semelidae and Psammobiidae as polyphyletic, indicating that the boundaries among several tellinoid families are more interdigitated than classical morphology-based classifications suggested [18]. The current state of knowledge is therefore better described as an active systematic problem than as a fully resolved classification: Tellinoidea itself is well supported, but the limits of Tellinidae and several internal subfamilial or generic concepts remain unstable [3, 6, 18].
The taxonomic uncertainty is not a weakness of the present study, but one of its motivations. A convolutional neural network trained on shell images does not test phylogeny directly. It does, however, test whether current taxonomic labels are consistently recoverable from standardized shell imagery. Strong performance for a genus or species suggests that the image set contains a coherent shell-based signal corresponding to the current label [9, 19]. Weak performance may indicate insufficient data, poor image quality, high within-class variability, interspecific similarity, or genuine taxonomic and morphological complexity [20, 21, 6]. It should not be interpreted automatically as evidence that a species or genus is invalid. Rather, CNN performance provides a morphology-based diagnostic benchmark: it reveals where the current classification is visually recoverable and where shell images alone are less decisive [9, 3, 18].
This distinction is especially important in Tellinidae because shell morphology is affected by both evolutionary history and environmental adaptation [4, 7, 8]. Several tellinid lineages show convergent or repeated shell solutions associated with infaunal life in soft sediments [4, 8, 17, 6]. Molecular studies indicate that some traditional morphological characters are homoplastic, and the literature also highlights phenotypic plasticity, cryptic diversity, and geographically structured species complexes [17, 3, 21, 20, 6, 18]. The Macoma balthica complex is a well-known example in which morphologically similar forms can show deep genetic divergence, while broader barcode studies have shown that cryptic or overlooked diversity is common in marine molluscs, including tellinid representatives [22, 23, 24, 21]. These findings place limits on what a shell-image classifier can reasonably be expected to achieve: a CNN can learn visual morphology, but it cannot recover characters absent from the image, such as anatomy, soft-part morphology, ecology, locality, reproductive biology, or DNA sequence divergence [9, 3, 20, 19].
At the same time, the unresolved state of Tellinidae makes the modelling results scientifically interesting [17, 3, 6, 18]. If a CNN performs well for a given taxon, this suggests that shell morphology alone is sufficient to recover that label under the image conditions used [9, 19]. If performance is poor or uneven, the result can point to taxa where shell characters are less exclusive, where current labels are visually heterogeneous, or where additional evidence may be needed for reliable identification [21, 20, 6]. In this sense, CNN-based identification is not only an applied tool for IdentifyShell.org, but also an empirical way to measure shell-based diagnosability across taxa. This idea is consistent with recent work using morphometrics and cytogenetic or molecular characters to supplement classical shell taxonomy, because it treats shell form as informative but incomplete rather than as a complete taxonomic system by itself [9, 20, 19, 18].
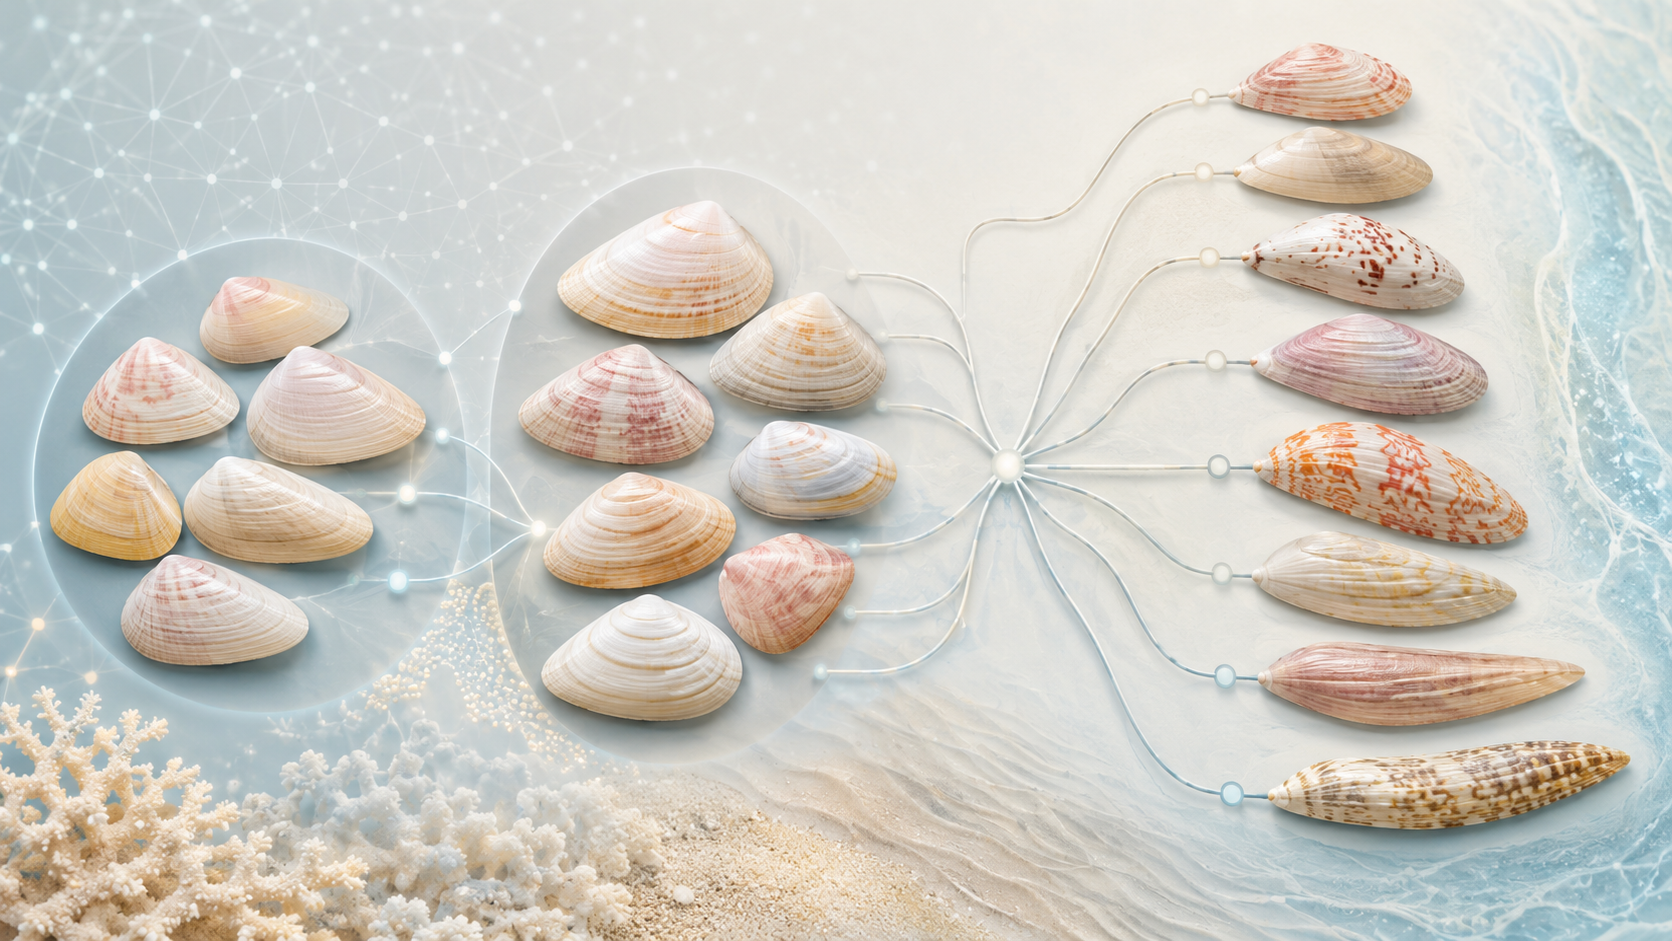
The present report evaluates this problem using two operational identification routes for Tellinidae. The first route is a flat Family→Species classifier, in which a single model assigns an image directly to one of 41 species. The second route is hierarchical: a Family→Genus model first assigns the image to one of 14 genera, after which the corresponding genus-level species model assigns the final species. Both routes therefore address the same practical task: species identification from a Tellinidae shell image. The comparison is not between “taxonomy” and “machine learning,” but between two ways of organizing the same visual recognition problem. The flat model asks whether the CNN can separate all species simultaneously. The hierarchical route asks whether the taxonomic structure of the family—first genus, then species—provides a more effective decomposition of the classification task [3, 1, 6, 18].
This comparison is particularly relevant because the biological and computational expectations are not identical. From a biological perspective, genus-level shell morphology may be more stable and easier to detect than species-level differences [4, 9, 3]. A Family→Genus model might therefore be expected to perform strongly. From an operational perspective, however, a strict hierarchy introduces routing risk: if the genus model assigns an image to the wrong genus, the correct species is no longer available to the downstream specialist. The final performance of the hierarchical route therefore depends not only on the quality of the genus-level species models, but also on the reliability of the genus router. This makes Tellinidae an informative case for testing whether hierarchical CNN classification provides a real advantage over a flat species classifier, or whether the apparent biological structure is offset by error propagation [3, 6, 18].
The report should therefore be read with two complementary aims. The first is practical: to determine which route gives the most reliable species-level identification for the selected Tellinidae dataset. The second is interpretive: to examine whether differences in model performance correspond to biologically meaningful patterns, such as genus-level cohesion, species-level shell diagnosability, morphological overlap, or unresolved taxonomic structure. The results are not proposed as a formal taxonomic revision, and they cannot replace integrative evidence from anatomy, molecular phylogenetics, geographic sampling, and ecological data. Instead, they provide a reproducible image-based benchmark of how well current Tellinidae labels can be recovered from shell morphology alone.
In this context, the model results can be used to ask several questions that are both technical and biological. Are genera generally easier to classify than species? Do genus-level specialists improve species identification once routing uncertainty is included? Which species are consistently recovered by shell images, and which remain ambiguous? Are difficult cases concentrated in particular genera such as Macoma, Eurytellina, Moerella, or Tellinella? And, most importantly for practical deployment, should IdentifyShell.org use a flat Family→Species model, a strict hierarchical route, or a route-selection strategy in which both model outputs are available and the most reliable prediction route is chosen according to confidence and historical performance?
By placing the CNN results against the current biological and systematic background of Tellinidae, this report treats model performance not only as a technical metric, but also as evidence about the visual recoverability of shell-based taxonomy. Strong performance supports the practical value of shell-image classification for many tellinid taxa. Weak or route-dependent performance highlights the limits of morphology-only identification and identifies taxa where additional data, taxonomic review, or more cautious inference may be required.
Methods
Data Acquisition
Shell images were collected from many online resources, from specialized websites on shell collecting to institutes and universities. One of the largest collections of shell images is available on GBIF. Online marketplace such as ebay also contain a large collection of images, but only a small percentage is included because the quality is not high. Other large shell image collections are available at , Malacopics, Femorale and Thelsica. A shell dataset created for AI is available [35].
The Tellinidae Dataset
Table S1 lists the species classes and image counts included in the evaluated Tellinidae model sets.
Species names and taxonomic assignments follow the
nomenclature
and classification
provided by WoRMS and MolluscaBase to ensure consistency and standardization.
Only genera with at least 100 images were included in the dataset, and for the genus models, at least 25
images were used for a species to be included.
Hardware and Software
Experiments were performed on a HP Omen 30L GT13 workstation equipped with an Intel(R) Core(TM) i9-10850K CPU @ 3.60GHz, 64 GB of RAM, and an NVIDIA GeForce RTX 3080 GPU with 10 GB of VRAM. All code was written in Python 3.10.12, leveraging TensorFlow/Keras for neural network operations, scikit-learn for classification and evaluation, and OpenCV for image manipulation.
CNN Architecture
The core of our image classification pipeline utilized the EfficientNetV2 B2 architecture. This model was
chosen based on its strong performance in previous
experiments with molluscan datasets; see also previous experiments [36], which
demonstrated its efficacy in capturing relevant features
for shell identification.
We employed a transfer learning approach, leveraging weights pre-trained on the ImageNet dataset to
initialize the EfficientNetV2 B2 model. During the fine-tuning
phase for our specific molluscan classification tasks, the majority of the base model's layers were kept
frozen to retain the generalized features learned from
ImageNet. Specifically, for some model training, top layers of the EfficientNetV2 B2 architecture were
unfrozen and allowed to update during training.
The standard EfficientNetV2 B2 architecture was used for its convolutional blocks, filter configurations,
and pooling strategies, as described in the original
literature for this model family. Our primary modifications were made to the classifier head. The original
top layers were replaced with a new sequence of layers
to adapt the model for our specific number of output classes (i.e., taxonomic groups). This custom head
consisted of a GlobalAveragePooling2D layer applied to
the output of the base model, followed by a BatchNormalization layer to stabilize activations, and a Dropout
layer
to mitigate overfitting. The final layer was a dense layer with a softmax activation function to produce
probabilities for each class.
Image Pre-processing
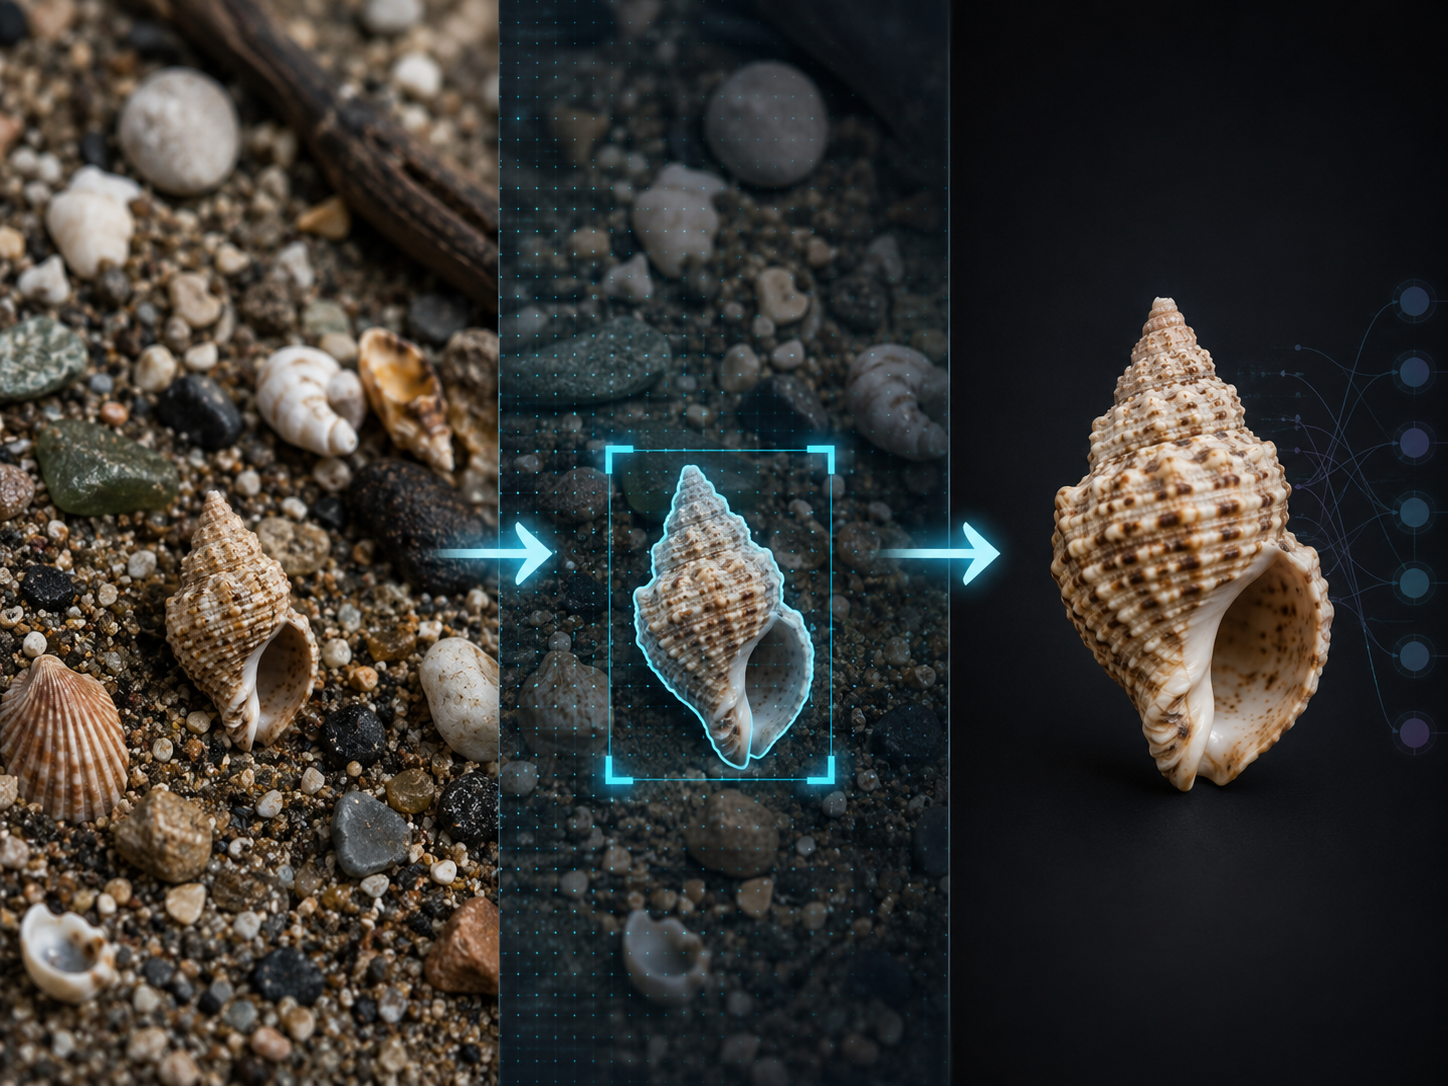
All names were checked against WoRMS or MolluscaBase for their validity. Names that were not found in WoRMS/MolluscaBase were excluded for further processing. While a large part of this data quality step was automated, a manual verification (time-consuming) step was also included. In addition to text-based quality control, both automated and manual preprocessing steps were applied to the images. Shells were detected in all images and cut out of the original image, having only 1 shell on each image. Other objects on the raw images (labels, measures, hands holding a shell, etc.) were removed. When appropiate the background was changed to a uniform black background. A square image was made by padding the black background. All shells were resized (400 x 400 px).
Training Regimen
All models were trained using the Adam optimization algorithm. A default learning rate of 0.0005 was
initially set; any deviations from this for specific
experiments are noted in their respective results sections. To dynamically adjust the learning rate during
training, a "reduce on plateau" schedule was
implemented. This schedule monitored the validation loss and reduced the learning rate by a factor (0.1) if
the validation loss did not improve for a
pre-defined number of epochs (5).
For the loss function, we employed focal loss with a gamma (γ) value of 2.0. This choice was made to address
potential class imbalances by down-weighting
the loss assigned to well-classified examples, thereby focusing training on harder-to-classify instances.
Training was conducted with a batch size of 64 images. Models were set to train for a maximum of 100 epochs.
However, an early stopping criterion was also
utilized, which halted training if the validation loss did not show improvement for a specified number of
consecutive epochs (patience=5). This helped
to prevent overfitting and select the model checkpoint with the best generalization performance on the
validation set.
To further mitigate overfitting, L2 regularization was applied to the kernel weights of the convolutional
and dense layers. A regularization factor of 0.0001
was used for this purpose.
Evaluation Metrics
The evaluation of the performance of the CNN models was carried out by using standard metrics for
classification: accuracy, precision, recall, and F1 score,
which are defined in terms of the number of FP (false positives); TP (true positives); TN (true negatives);
and FN (false negatives) as follows:
Results
Model sets and taxonomic coverage
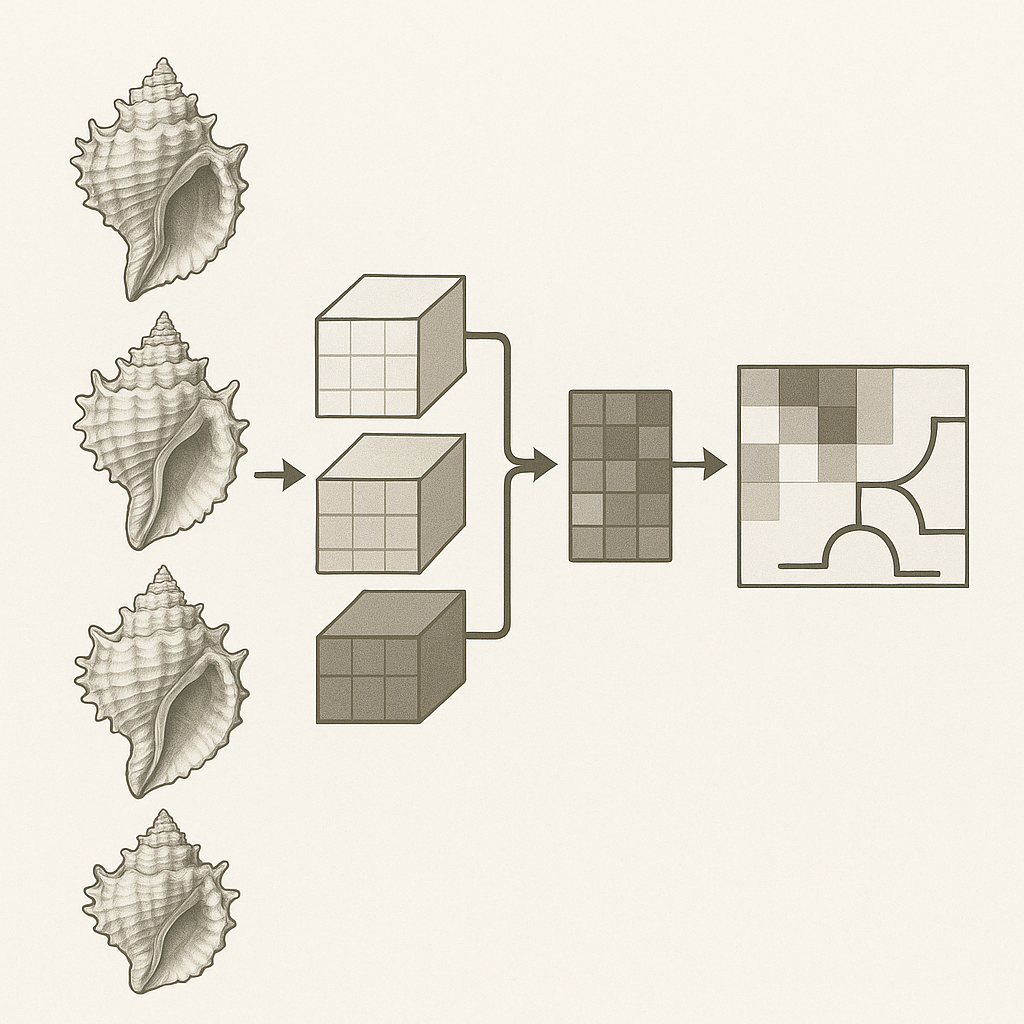
The Tellinidae modelling series was evaluated using two related but differently structured species sets. The first set contained 41 species distributed across 14 genera. These were the genera for which at least two species met the inclusion criterion of having at least 25 available images. This 41-species set was therefore suitable for a strict hierarchical comparison, because each genus contained more than one candidate species and required a downstream Genus→Species specialist after Family→Genus routing. The three evaluated route structures are summarized in Figure 1, and their corresponding taxonomic and image coverage is given in Table 1.
The second set extended the taxonomic scope to 55 species distributed across 27 genera. This expansion added species from genera that were represented by only one species meeting the minimum image threshold. In other words, the additional genera were not necessarily biologically monospecific; they were single-representative genera within the available image dataset. This distinction is important for interpreting the extended hierarchy: for multi-species genera, the hierarchy requires a Genus→Species classifier, whereas for single-representative genera, a correct genus prediction directly determines the species label. The extended 55-species set was therefore used to test whether Tellinidae classification could be scaled to broader genus and species coverage while still preserving operational performance.
The 41-species model set comprised the genera Arcopagia, Ardeamya, Eurytellina, Gastrana, Macoma, Macomona, Macomopsis, Moerella, Pharaonella, Scutarcopagia, Serratina, Strigilla, Tellinella, and Tellinides. These 14 genera were represented both in the flat 41-species Family→Species classifier and in the corresponding collection of genus-level species specialists. The flat 41-species model used 3,032 species-labelled images and assigned each image directly to one of the 41 species. The corresponding hierarchical route used a 14-class Family→Genus router followed by one of 14 Genus→Species specialist models. Together, these 14 specialists covered the same 41 final species and the same 3,032 species-labelled images as the flat 41-species model.
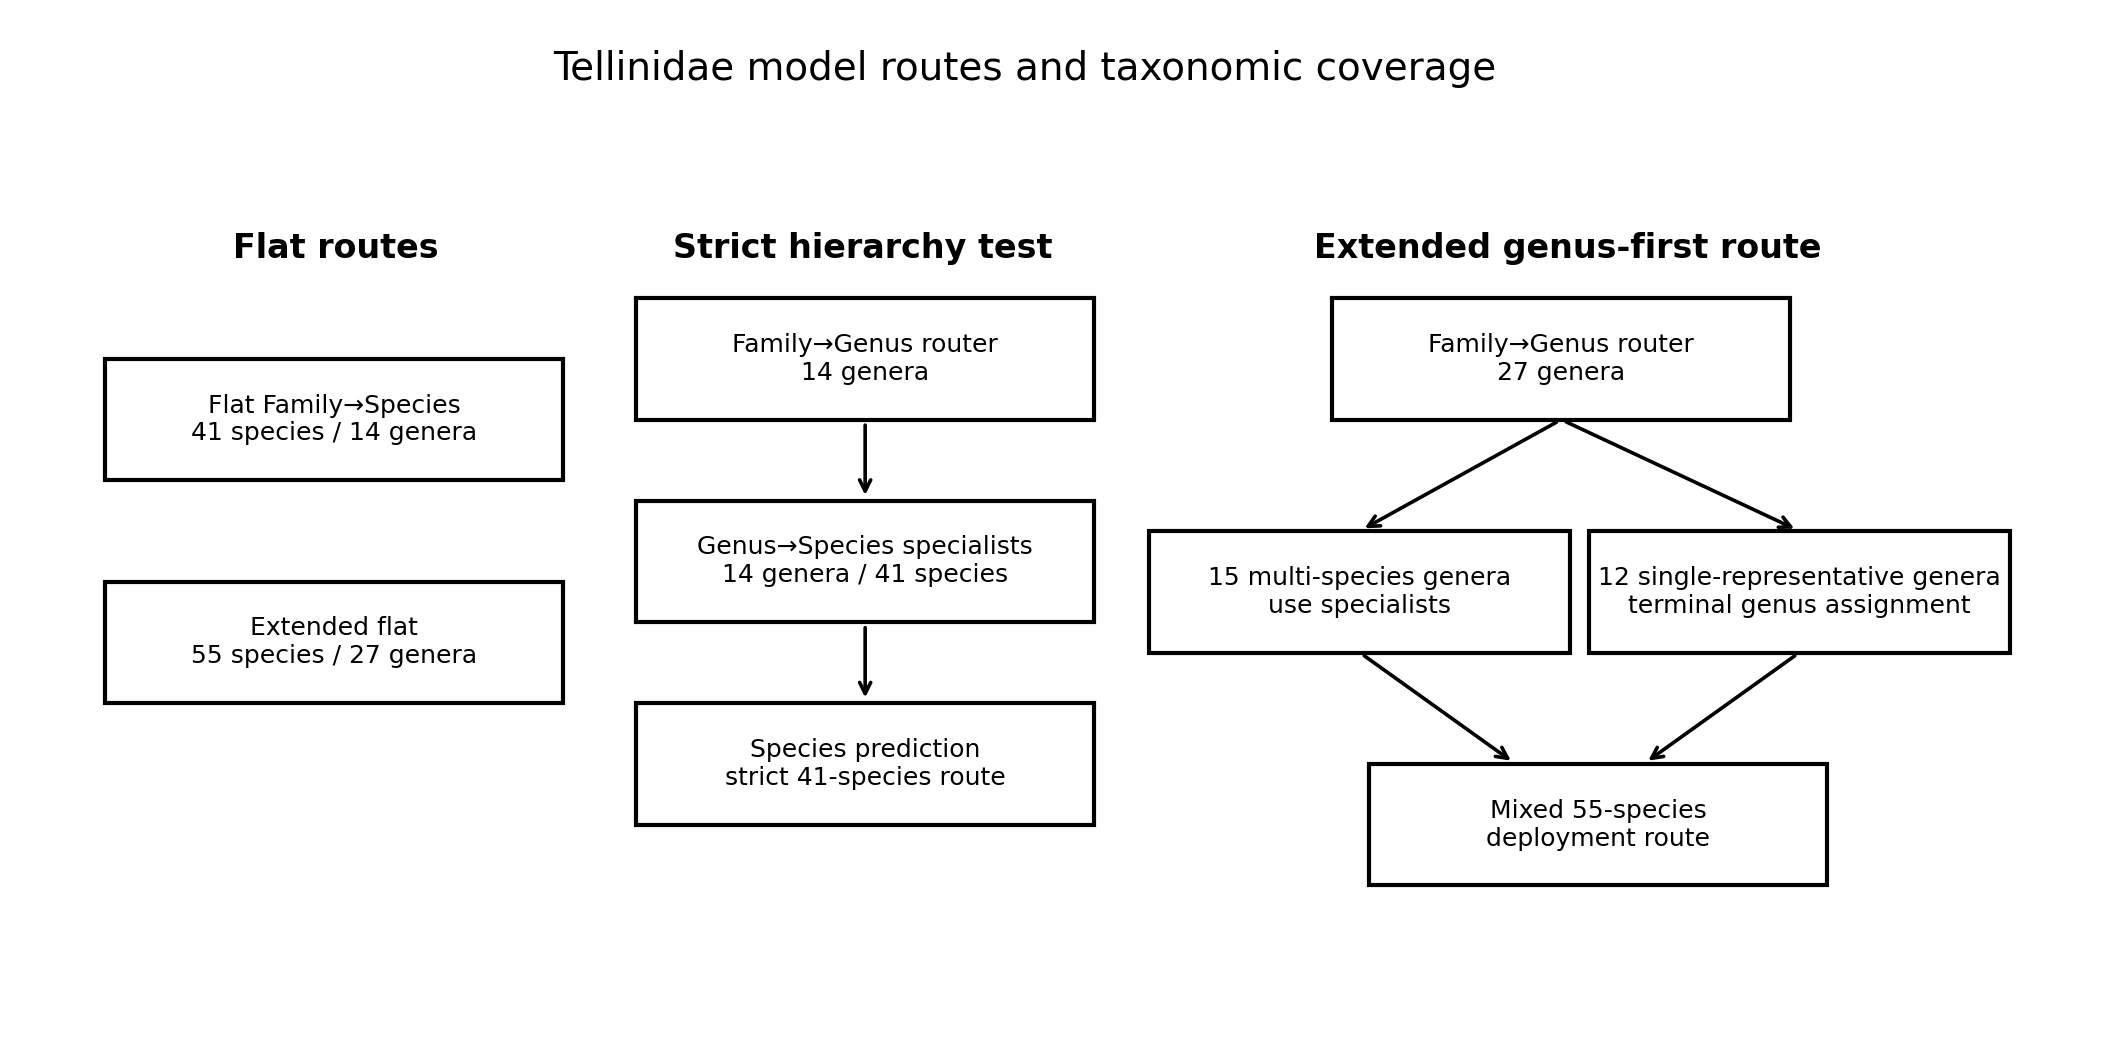
Overview of the three model configurations evaluated in this study: the flat 41-species route, the 41-species Family→Genus→Species hierarchy, and the extended genus-first route across 55 species and 27 genera. In the extended route, 15 multi-species genera are handled by Genus→Species specialists, whereas 12 genera represented by one eligible species in the current dataset terminate at genus-level assignment.
The extended 55-species model set increased the final species label space from 41 to 55 species and the genus label space from 14 to 27 genera. The extended flat Family→Species classifier used 5,986 species-labelled images and assigned each image directly to one of the 55 species. The additional genera were Ameritella, Bathytellina, Bosemprella, Dallitellina, Fabulina, Limecola, Macomangulus, Megangulus, Peronaea, Phylloda, Quidnipagus, Rexithaerus, and Tellina. Of these, Ameritella was represented by two eligible species, Ameritella agilis and Ameritella modesta. The remaining added genera were represented by one eligible species in the present 55-species model set.
To support an extended hierarchical route, a new 27-class Family→Genus router was trained using all genera represented in the extended 55-species dataset. This model covered the full genus label space used by the extended flat Family→Species classifier. Because genus-level routing can use all available images assigned to a genus, including images not belonging to species retained as final species classes, the 27-genus router was trained on a broader genus-labelled dataset of 8,772 images. The extended hierarchy therefore consists of the 27-genus router followed by a species decision step. For genera represented by more than one eligible species, the image is passed to the corresponding Genus→Species specialist. For genera represented by one eligible species in the current label space, the predicted genus directly determines the species label.
In this extended hierarchy, 15 multi-species genera are handled by genus-level specialists. The remaining 12 genera are represented by one eligible species in the present 55-species set and therefore do not require a downstream specialist for this particular model configuration. The deterministic assignment for these genera is a property of the current dataset and label space, not a taxonomic statement that the genera themselves contain only one species.
| Model set / route component | Genera | Final species | Images |
|---|---|---|---|
| Flat Family→Species model, 41-species set | 14 | 41 | 3,032 |
| Family→Genus router, 14-genus set | 14 | — | 5,102 |
| Genus→Species specialists, original hierarchy | 14 | 41 | 3,032 |
| Flat Family→Species model, extended set | 27 | 55 | 5,986 |
| Family→Genus router, extended set | 27 | — | 8,772 |
| Genus→Species specialists, extended hierarchy | 15 | 43 | 3,163 |
| Genera represented by one eligible species | 12 | 12 | 2,823 |
| Extended hierarchy, full operational coverage | 27 | 55 | 5,986 species-labelled images; 8,772 genus-labelled router images |
An important technical change in the current result files is that the non-balanced prediction records now include image-level identifiers. This makes it possible to perform image-paired replay of the identification routes. The flat Family→Species models, the Family→Genus routers, and the Genus→Species specialists can therefore be compared on the same physical images, rather than only through aggregate accuracy estimates. This distinction is essential for evaluating a strict hierarchy, because the operational cascade must use the specialist selected by the predicted genus, not the known true genus. The full species-level inclusion list and image counts are provided in Table S1.
Flat Family→Species classification: 41-species and 55-species baselines
Two flat Family→Species classifiers were evaluated as direct species-level baselines for Tellinidae. The first model used the restricted 41-species set, corresponding to the species included in genera with at least two eligible species. The second model used the extended 55-species set, adding species from genera represented by one eligible species in the present dataset, as well as the newly included two-species genus Ameritella. Both models used the same general architecture and assigned each image directly to a species label without an intermediate genus-routing step. The overall performance of the two flat baselines is summarized in Table 2.
The 41-species flat model was trained on 3,032 species-labelled images and evaluated on 606 test images. It reached a training accuracy of 90.73%, validation accuracy of 83.99%, and test accuracy of 82.18%. The weighted F1-score was 82.32%. This result shows that direct species-level classification across the 41-species Tellinidae set is feasible, but that the flat model leaves a substantial error rate when all species are treated as a single decision space.
The extended 55-species flat model was trained on 5,986 species-labelled images and evaluated on 1,197 test images. Despite the larger label space, it performed better than the corrected 41-species flat model, reaching 90.23% test accuracy and a weighted F1-score of 90.39%. Training and validation accuracy were 94.26% and 90.06%, respectively. Thus, expanding the species set did not reduce overall flat-model performance; instead, the broader model achieved a higher aggregate test accuracy.
| Model | Genera | Species | Training images | Test images | Correct | Incorrect | Train acc. | Val. acc. | Test acc. | Weighted F1 | Epochs |
|---|---|---|---|---|---|---|---|---|---|---|---|
| Flat Family→Species, 41-species set |
14 | 41 | 3,032 | 606 | 498 | 108 | 90.73% | 83.99% | 82.18% | 82.32% | 26 |
| Extended flat Family→Species, 55-species
set |
27 | 55 | 5,986 | 1,197 | 1,080 | 117 | 94.26% | 90.06% | 90.23% | 90.39% | 55 |
This improvement should not be interpreted simply as evidence that adding species always improves classification. The extended model included 14 additional species, many of which were visually well recovered. On the newly added species alone, the model reached 92.45% accuracy, whereas on the 41 species shared with the restricted model it reached 88.11%. The higher overall performance of the 55-species model is therefore partly explained by strong recovery of several added taxa, including Phylloda foliacea, Rexithaerus secta, Tellina radiata, Bosemprella incarnata, Bathytellina citrocarnea, and Dallitellina rostrata. These species appear to contribute relatively clear visual signals in the current image set. The decomposition of the extended flat model into shared and newly added species subsets is shown in Table 3.
| Subset | Species | Test images | Correct | Incorrect | Accuracy | Interpretation |
|---|---|---|---|---|---|---|
| Species shared with the 41-species flat model | 41 | 614 | 541 | 73 | 88.11% | The extended model remained strong on the shared species subset, but performance varied by species. |
| Additional species in the extended model | 14 | 583 | 539 | 44 | 92.45% | The added species were, on average, highly recoverable from shell images. |
| All species in the extended model | 55 | 1,197 | 1,080 | 117 | 90.23% | The extended flat model provided broader coverage while maintaining high overall accuracy. |
The extended model was nevertheless not uniformly strong across all added species. Fabulina fabula, Peronaea planata, and Megangulus bodegensis were weaker than most other added taxa, with accuracies below 80%. This indicates that the added label space contains both visually distinctive species and more ambiguous taxa. Similarly, within the 41 shared species, the extended model improved several species that were weak in the restricted flat model, including Eurytellina angulosa, Macomona deltoidalis, Gastrana fragilis, Macoma incongrua, and Strigilla chroma. However, some shared species declined, especially Scutarcopagia linguafelis, Eurytellina lineata, Strigilla sincera, and Tellinella tithonia. The extended flat model therefore improved the overall baseline, but did not improve every species uniformly.
Taken together, the two flat models provide different baselines for the later route comparisons. The 41-species flat model is the appropriate direct comparator for the original 14-genus hierarchy, because both cover the same final species set. The extended 55-species flat model is the appropriate baseline for broader operational coverage, because it covers all 55 retained species across 27 genera. Its higher overall accuracy shows that the flat architecture can scale to the extended Tellinidae label space, but the uneven species-level changes indicate that global accuracy alone is insufficient for judging operational reliability.
Family→Genus routing: from 14 to 27 genera
Two Family→Genus routers were evaluated. The first router corresponded to the original hierarchical model set and classified Tellinidae images into 14 genera. The second router extended the genus label space to all 27 genera represented in the extended 55-species model. Both models were evaluated using the per-image prediction records. Overall router performance is summarized in Table 4, and the per-genus performance of the extended 27-genus router is shown in Table 5.
The 14-genus router, was trained on 5,102 genus-labelled images and evaluated on 1,020 test images. It correctly classified 988 images and misclassified 32, giving a test accuracy of 96.86%. The weighted precision, recall, and F1-score were all close to this value, with weighted F1 = 96.85%. Training and validation accuracy were also similar, at 97.06% and 96.86%, respectively, indicating stable generalization.
| Model | Genera | Training images | Test images | Correct | Incorrect | Train acc. | Val. acc. | Test acc. | Weighted F1 | Epochs |
|---|---|---|---|---|---|---|---|---|---|---|
| Family→Genus router, 14 genera |
14 | 5,102 | 1,020 | 988 | 32 | 97.06% | 96.86% | 96.86% | 96.85% | 32 |
| Family→Genus router, 27 genera |
27 | 8,772 | 1,202 | 1,157 | 45 | 97.66% | 96.29% | 96.26% | 96.29% | 68 |
The extended 27-genus router, was trained on 8,772 genus-labelled images and evaluated on 1,202 test images. It correctly classified 1,157 images and misclassified 45, giving a test accuracy of 96.26%. The weighted F1-score was 96.29%. Thus, expanding the genus label space from 14 to 27 genera caused only a small decrease in overall routing performance: 96.86% to 96.26%. Because the two models were evaluated on different label spaces and test sets, this should be interpreted as a descriptive comparison rather than a paired statistical test. Nevertheless, the result shows that genus-level routing remains strong even when the number of genera is nearly doubled.
The 14-genus router performed well across nearly all included genera. Perfect test-set recall was obtained for Arcopagia, Gastrana, and Macomopsis. The only genus below 90% test accuracy was Serratina, with 83.33% accuracy. The largest residual confusions involved Serratina with Macomona, Eurytellina, and Pharaonella, followed by Scutarcopagia with Macomona, Ardeamya with Tellinella, and Scutarcopagia with Tellinella. These errors indicate that even in the restricted 14-genus setting, residual routing difficulty was concentrated in a limited set of visually overlapping genera.
| Genus | Test images | Correct | Incorrect | Accuracy / recall | Precision | F1-score |
|---|---|---|---|---|---|---|
| Ameritella | 45 | 43 | 2 | 95.56% | 100.00% | 97.73% |
| Arcopagia | 36 | 36 | 0 | 100.00% | 97.30% | 98.63% |
| Ardeamya | 45 | 44 | 1 | 97.78% | 93.62% | 95.65% |
| Bathytellina | 48 | 47 | 1 | 97.92% | 100.00% | 98.95% |
| Bosemprella | 60 | 59 | 1 | 98.33% | 98.33% | 98.33% |
| Dallitellina | 76 | 73 | 3 | 96.05% | 100.00% | 97.99% |
| Eurytellina | 149 | 142 | 7 | 95.30% | 97.26% | 96.27% |
| Fabulina | 26 | 25 | 1 | 96.15% | 75.76% | 84.75% |
| Gastrana | 35 | 35 | 0 | 100.00% | 100.00% | 100.00% |
| Limecola | 14 | 14 | 0 | 100.00% | 100.00% | 100.00% |
| Macoma | 60 | 60 | 0 | 100.00% | 96.77% | 98.36% |
| Macomangulus | 51 | 47 | 4 | 92.16% | 92.16% | 92.16% |
| Macomona | 16 | 15 | 1 | 93.75% | 93.75% | 93.75% |
| Macomopsis | 45 | 44 | 1 | 97.78% | 100.00% | 98.88% |
| Megangulus | 7 | 4 | 3 | 57.14% | 100.00% | 72.73% |
| Moerella | 72 | 67 | 5 | 93.06% | 94.37% | 93.71% |
| Peronaea | 19 | 16 | 3 | 84.21% | 94.12% | 88.89% |
| Pharaonella | 7 | 7 | 0 | 100.00% | 63.64% | 77.78% |
| Phylloda | 66 | 66 | 0 | 100.00% | 100.00% | 100.00% |
| Quidnipagus | 24 | 22 | 2 | 91.67% | 100.00% | 95.65% |
| Rexithaerus | 33 | 33 | 0 | 100.00% | 91.67% | 95.65% |
| Scutarcopagia | 31 | 29 | 2 | 93.55% | 93.55% | 93.55% |
| Serratina | 23 | 21 | 2 | 91.30% | 95.45% | 93.33% |
| Strigilla | 83 | 80 | 3 | 96.39% | 100.00% | 98.16% |
| Tellina | 24 | 24 | 0 | 100.00% | 100.00% | 100.00% |
| Tellinella | 78 | 76 | 2 | 97.44% | 96.20% | 96.82% |
| Tellinides | 29 | 28 | 1 | 96.55% | 90.32% | 93.33% |
The 27-genus router also showed strong overall performance, but the extended label space introduced additional zones of visual overlap. Several genera were recovered with 100% test-set recall, including Arcopagia, Gastrana, Limecola, Macoma, Pharaonella, Phylloda, Rexithaerus, and Tellina. However, recall alone is not sufficient for interpretation, because some of these genera also received false-positive predictions from other genera. Based on F1-score, the strongest genera included Gastrana, Limecola, Phylloda, Tellina, Bathytellina, Macomopsis, Arcopagia, Macoma, Bosemprella, and Dallitellina.
The weakest genera in the 27-genus router were Megangulus, Pharaonella, Fabulina, Peronaea, and Macomangulus. Megangulus had the lowest F1-score, at 0.727, although this estimate is based on only seven test images. Pharaonella had perfect recall but low precision, producing an F1-score of 0.778. Fabulina also showed an asymmetric pattern, with high recall but lower precision, resulting in an F1-score of 0.847. These cases are important because they identify genera for which the router may introduce errors in an extended hierarchy.
The 27-genus router produced few errors overall, and the remaining errors were distributed across several small confusion pairs. The most frequent undirected pair was Eurytellina–Moerella, but because the absolute number of errors was low, these patterns should be treated as preliminary indicators of visual overlap rather than robust biological signals. Other prominent confusions involved Fabulina with Macomangulus, Macomangulus with Fabulina, Macomona, Scutarcopagia, and Tellinides, and a broader group of overlaps among Eurytellina, Moerella, Serratina, Peronaea, and Pharaonella. These results suggest that the extended genus router captures most genus-level shell structure, but also reveals several regions of visual similarity among tellinid genera.
Overall, the Family→Genus results support hierarchical classification as an operational strategy. The 14-genus router provides a reliable first stage for the original 41-species hierarchy, while the 27-genus router shows that genus-level routing can be extended to the broader 55-species label space with only a small loss in overall accuracy. The remaining question is therefore not whether genus-level routing is feasible, but how best to use it in the extended hierarchy: multi-species genera require downstream Genus→Species specialists, whereas genera represented by one eligible species in the current label space can be resolved directly after the genus prediction.
Genus-level species classifiers
Fifteen Genus→Species specialist classifiers were evaluated as downstream components of the hierarchical Tellinidae route. These consisted of the original 14 genus specialists used in the 41-species hierarchy, plus the newly added Ameritella specialist required for the extended 55-species hierarchy. Together, the 15 specialists covered 43 species: the 41 species from the original multi-species genera plus Ameritella agilis and Ameritella modesta. The remaining 12 genera in the extended 55-species model were represented by one eligible species in the current label space and therefore did not require Genus→Species specialists. The specialist-stage accuracy ranking is shown in Figure 2, with full specialist training and test metrics provided in Table S4.
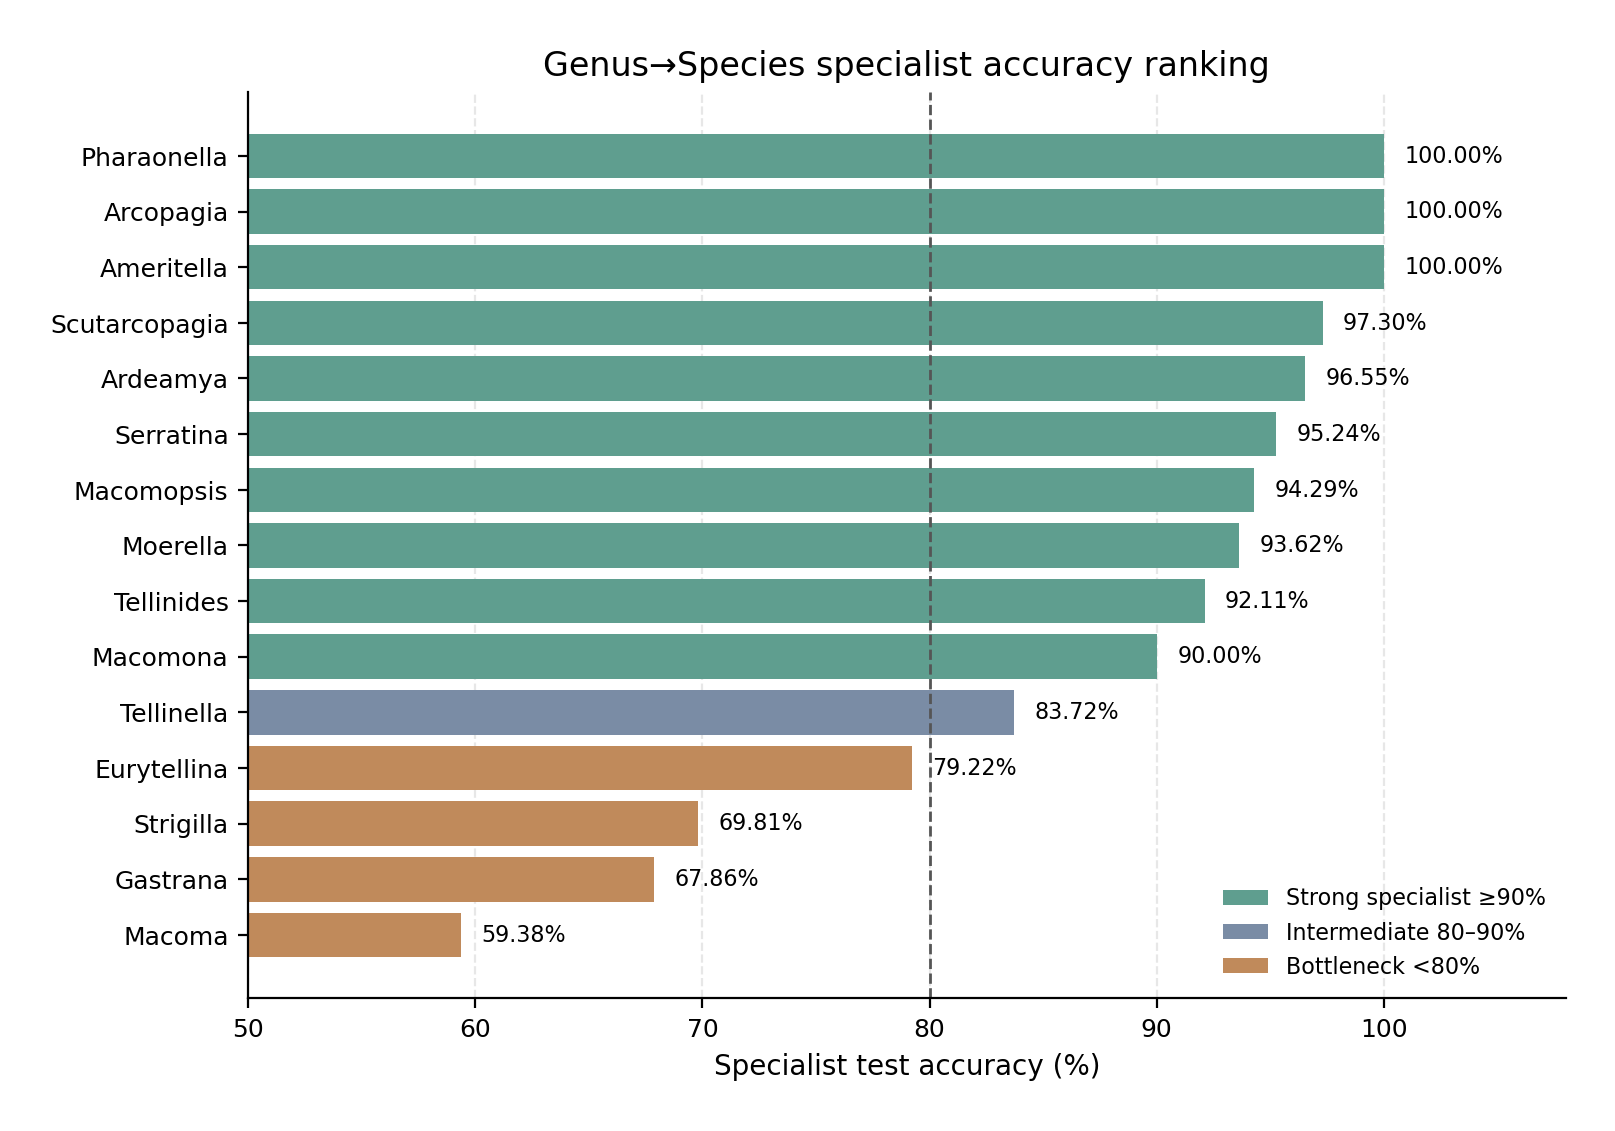
Bars show test accuracy for each genus-level species specialist. Specialists are grouped visually by performance category: strong specialists at or above 90%, intermediate specialists between 80% and 90%, and bottleneck specialists below 80%. The ranking shows that several genera are highly recoverable after genus-level restriction, especially Ameritella, Arcopagia, Pharaonella, Scutarcopagia, and Ardeamya, whereas Macoma, Gastrana, Strigilla, Eurytellina and Tellinella remain the main specialist-stage bottlenecks.
Across the 15 specialists, the combined specialist test sets contained 1,254 images, of which 1,076 were correctly classified. This corresponds to an aggregate specialist-stage accuracy of 85.81%. This value should not be interpreted as the final accuracy of the operational hierarchy, because it evaluates each specialist on images already belonging to its own genus. Final cascade performance additionally depends on the Family→Genus router selecting the correct specialist. Nevertheless, the specialist results identify which genera are well resolved after genus-level restriction and which genera remain species-level bottlenecks.
The strongest specialist models were Ameritella, Arcopagia, and Pharaonella, each of which reached 100% test accuracy. The Ameritella result is important for the extended hierarchy because it shows that the newly added two-species genus did not introduce an additional species-level bottleneck: all 52 test images were classified correctly. Scutarcopagia also performed very strongly, with 97.30% accuracy, followed by Ardeamya at 96.55% and Serratina at 95.24%. These genera therefore appear to be well suited to genus-level decomposition, with species that are visually separable once the decision space is restricted to the genus.
A second group of specialists showed good but not perfect performance. Macomopsis reached 94.29% accuracy, Moerella 93.62%, Tellinides 92.11%, and Macomona 90.00%. These models are operationally useful, but their remaining errors indicate that genus-level restriction does not eliminate all species-level ambiguity. In particular, the Tellinides specialist had one weaker species class, T. striatus, and Macomona showed residual errors in both included species.
The main bottlenecks were Macoma, Gastrana, Strigilla, Eurytellina, and Tellinella. Macoma was the weakest specialist, with 59.38% test accuracy. Its errors were broad across the genus: M. calcarea reached only 33.33%, M. incongrua 40.00%, and M. nasuta 66.67%. Gastrana reached 67.86% overall accuracy because G. fragilis was not recovered in the test set, whereas G. matadoa was classified correctly. Strigilla also performed weakly at 69.81%, mainly because S. carnaria and S. chroma were difficult. Eurytellina reached 79.22%, with weaknesses in E. alternata, E. angulosa, and E. punicea. Tellinella reached 83.72%, with the lowest species-level accuracies in T. tithonia, T. philippii, and T. cruciata. The weakest species-level classes are summarized in Figure 3; exact correct/incorrect counts are provided in Table S6.
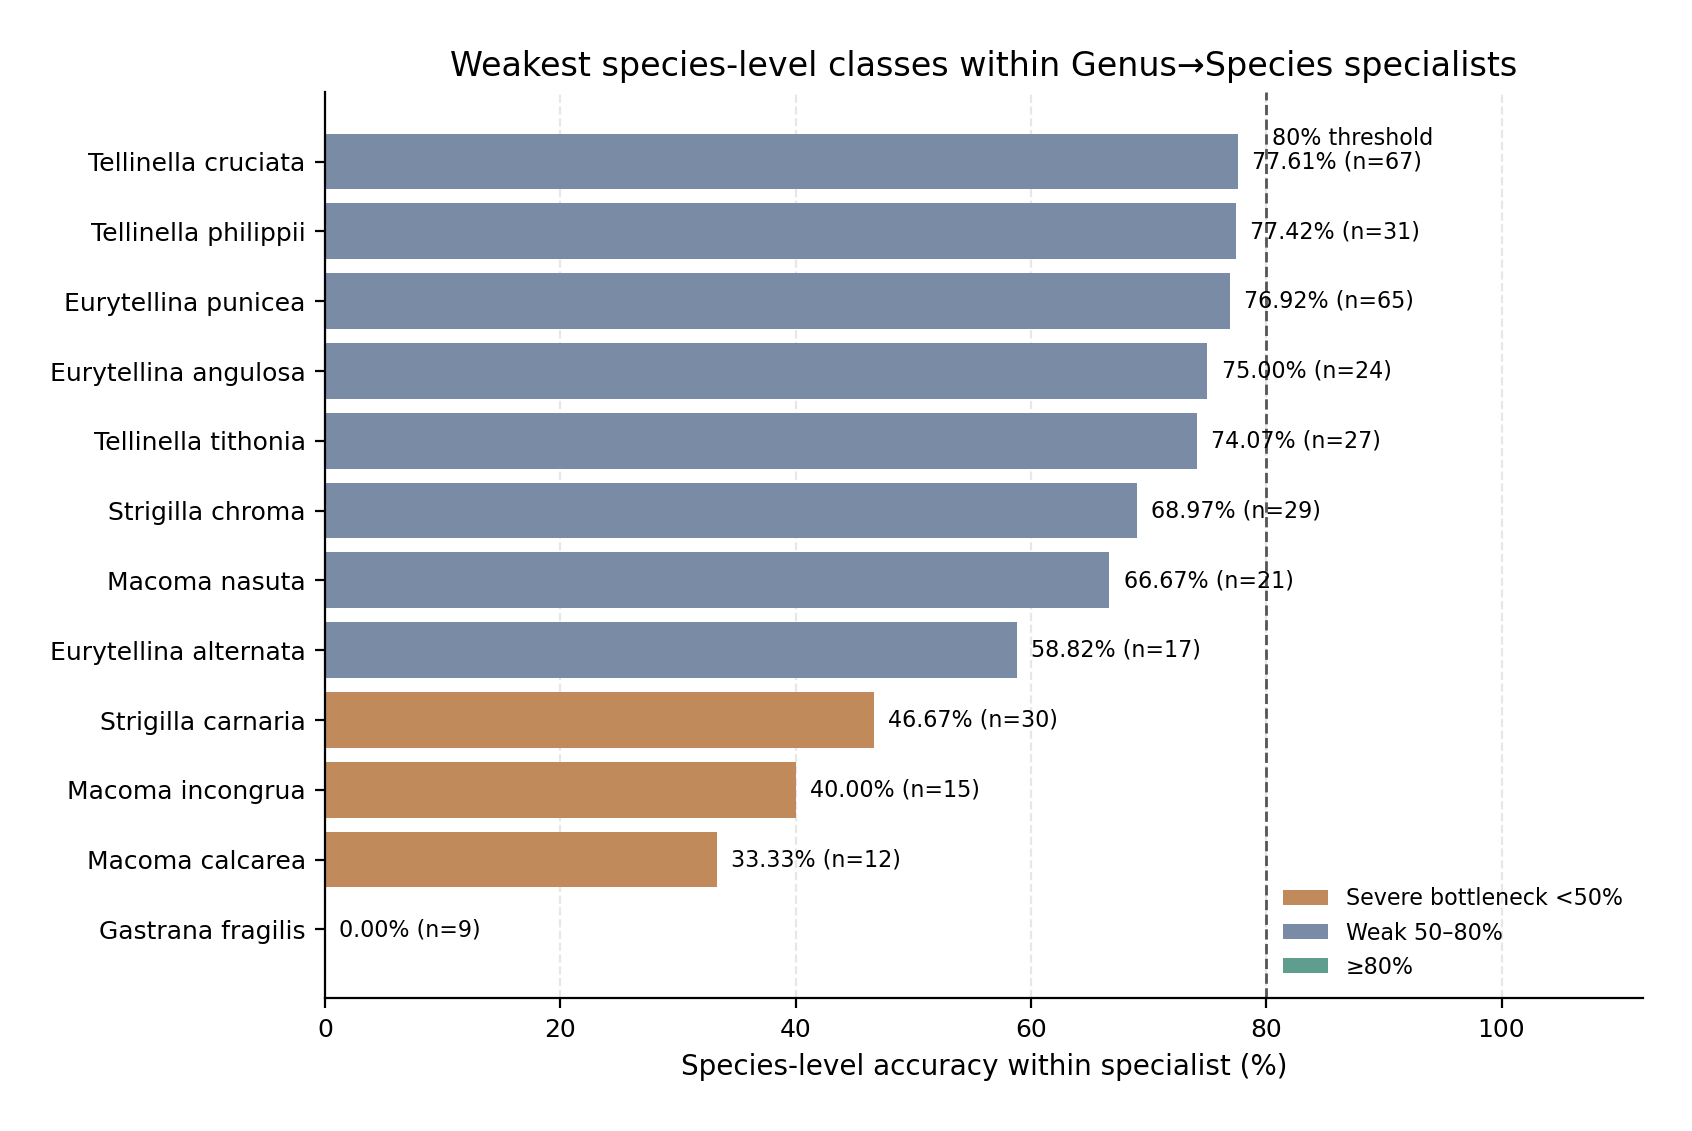
Bars show species-level accuracy for the weakest classes within the genus-level specialist models. Labels include the number of test images for each species. The dashed vertical line marks 80% accuracy as a practical threshold for reduced reliability. The weakest classes were concentrated in the specialist bottleneck genera, especially Gastrana, Macoma, Strigilla, Eurytellina, and Tellinella. These species should be prioritized for image audit, additional curated images, label review, and, where needed, alternative views or supplementary taxonomic evidence.
These results show that genus-level decomposition is not uniformly beneficial at the specialist stage. In several genera, especially Ameritella, Arcopagia, Pharaonella, Scutarcopagia, Ardeamya, and Serratina, species are highly recoverable after the genus is fixed. In contrast, Macoma, Gastrana, Strigilla, Eurytellina, and Tellinella remain difficult even within a restricted genus-level label space. These genera represent the principal species-level bottlenecks of the hierarchical approach and should be the main targets for further data review, image curation, or alternative modelling strategies.
Image-paired replay of the 41-species strict hierarchy
The strict Family→Genus→Species hierarchy was replayed image by image on the same test set used for the 41-species flat Family→Species model. This replay replaces the earlier estimate-based comparison, in which hierarchical performance was approximated from aggregate Family→Genus and Genus→Species summaries. In the replay, each image was first classified by the Family→Genus router. The image was then passed to the Genus→Species specialist corresponding to the predicted genus. The final cascade prediction therefore reflects the actual operational behaviour of a strict hierarchy, including the effect of any genus-routing errors. The image-paired replay of the 41-species flat model against the strict hierarchy is summarized in Table 6.
The replay used 606 test images covering 41 species in 14 genera. The corrected flat Family→Species model classified 498 images correctly, giving an accuracy of 82.18%. The Family→Genus router selected the correct genus for 601 of the 606 images, corresponding to a genus-routing accuracy of 99.17% on this same reference set. After routing each image to the selected specialist, the full strict cascade classified 559 images correctly at species level, giving a final accuracy of 92.24%.
| Metric | Value |
|---|---|
| Reference test images | 606 |
| Species | 41 |
| Genera | 14 |
| Flat Family→Species correct | 498 / 606 |
| Flat Family→Species accuracy | 82.18% |
| Family→Genus router correct on same images | 601 / 606 |
| Family→Genus router accuracy on same images | 99.17% |
| Strict cascade species-level correct | 559 / 606 |
| Strict cascade species-level accuracy | 92.24% |
| Cascade − flat difference | +10.07 percentage points |
| Correct by both routes | 472 |
| Correct only by flat route | 26 |
| Correct only by strict cascade | 87 |
| Wrong by both routes, same prediction | 11 |
| Wrong by both routes, different prediction | 10 |
| McNemar exact p-value | 7.12 × 10⁻⁹ |
The strict hierarchy therefore improved species-level accuracy by 10.07 percentage points relative to the flat Family→Species route. The paired image-level comparison showed that 472 images were correctly classified by both routes. The flat model alone was correct for 26 images, whereas the cascade alone was correct for 87 images. Both routes were wrong for 21 images: in 11 cases they produced the same wrong species prediction, and in 10 cases they produced different wrong species predictions. McNemar’s exact test on the discordant cases showed that the difference was statistically significant, with 26 flat-only correct cases versus 87 cascade-only correct cases (p = 7.12 × 10⁻⁹).
The improvement was broad across the genus set, but not universal. The cascade improved performance in 11 of the 14 genera, was equal to the flat model in Scutarcopagia, and was worse in Gastrana and Serratina. The largest genus-level gains were observed in Macomona (+20.59 percentage points), Macoma (+18.18), Moerella (+17.78), Tellinella (+15.83), Ardeamya (+15.38), Strigilla (+14.55), and Eurytellina (+13.95). These results indicate that, for most genera, reducing the final species decision space to a genus-level specialist improved species discrimination.
The two negative exceptions were informative. In Gastrana, the genus router was correct for all 28 images, but the cascade accuracy was lower than the flat accuracy because the Gastrana specialist failed on Gastrana fragilis. In Serratina, the flat model classified all 21 images correctly, whereas the cascade classified 14 correctly. Most of this loss was concentrated in Serratina capsoides. Thus, the main failures of the strict hierarchy were not caused by widespread genus-routing error, but by specific specialist-stage weaknesses.
At species level, the largest gains occurred in species that were weak or moderate in the flat model but were better recovered by the corresponding genus specialist. Examples include Eurytellina angulosa, Macoma calcarea, Strigilla carnaria, Macomona deltoidalis, Moerella distorta, Tellinella cruciata, Moerella donacina, and Tellinella virgata. The main species-level losses were concentrated in Gastrana fragilis and Serratina capsoides, with smaller losses in Eurytellina alternata, Arcopagia fausta, and Strigilla dichotoma.
Only five images were routed to the wrong genus. These involved Macoma incongrua, Eurytellina punicea, Tellinella tithonia, Serratina capsoides, and Ardeamya tokunagai. Because the genus router was correct for 99.17% of images, routing error contributed little to the overall cascade error rate. The dominant determinant of cascade success was therefore the balance between specialist-stage improvement in most genera and specialist-stage weakness in a small number of genera.
Taken together, the image-paired replay changes the operational conclusion for the 41-species Tellinidae set. The strict hierarchy is not merely a diagnostic alternative to the flat Family→Species classifier; in this corrected model set, it is the stronger species-identification route. Its advantage comes from very high genus-routing reliability combined with better species discrimination in most genus-level specialists.
Comparison with the extended flat model on the shared 41-species subset
A second image-paired replay was performed to test whether the advantage of the strict hierarchy remained when the comparator was not the 41-species flat model, but the stronger extended 55-species Family→Species model. For this analysis, the extended flat model was restricted to the 41 species and 14 genera also covered by the strict 14-genus hierarchy. The comparison therefore used the same final species label space as the strict hierarchy, while testing whether the broader flat model reduced or eliminated the benefit of genus-level decomposition. The corresponding replay against the extended flat model restricted to the shared 41-species subset is summarized in Table 7.
| Metric | Value |
|---|---|
| Reference test images | 614 |
| Species | 41 |
| Genera | 14 |
| Extended flat Family→Species correct | 541 / 614 |
| Extended flat Family→Species accuracy | 88.11% |
| Family→Genus router correct on same images | 607 / 614 |
| Family→Genus router accuracy on same images | 98.86% |
| Strict cascade species-level correct | 577 / 614 |
| Strict cascade species-level accuracy | 93.97% |
| Cascade − extended flat difference | +5.86 percentage points |
| Correct by both routes | 521 |
| Correct only by extended flat route | 20 |
| Correct only by strict cascade | 56 |
| Wrong by both routes, same prediction | 8 |
| Wrong by both routes, different prediction | 9 |
| McNemar exact p-value | 4.37 × 10⁻⁵ |
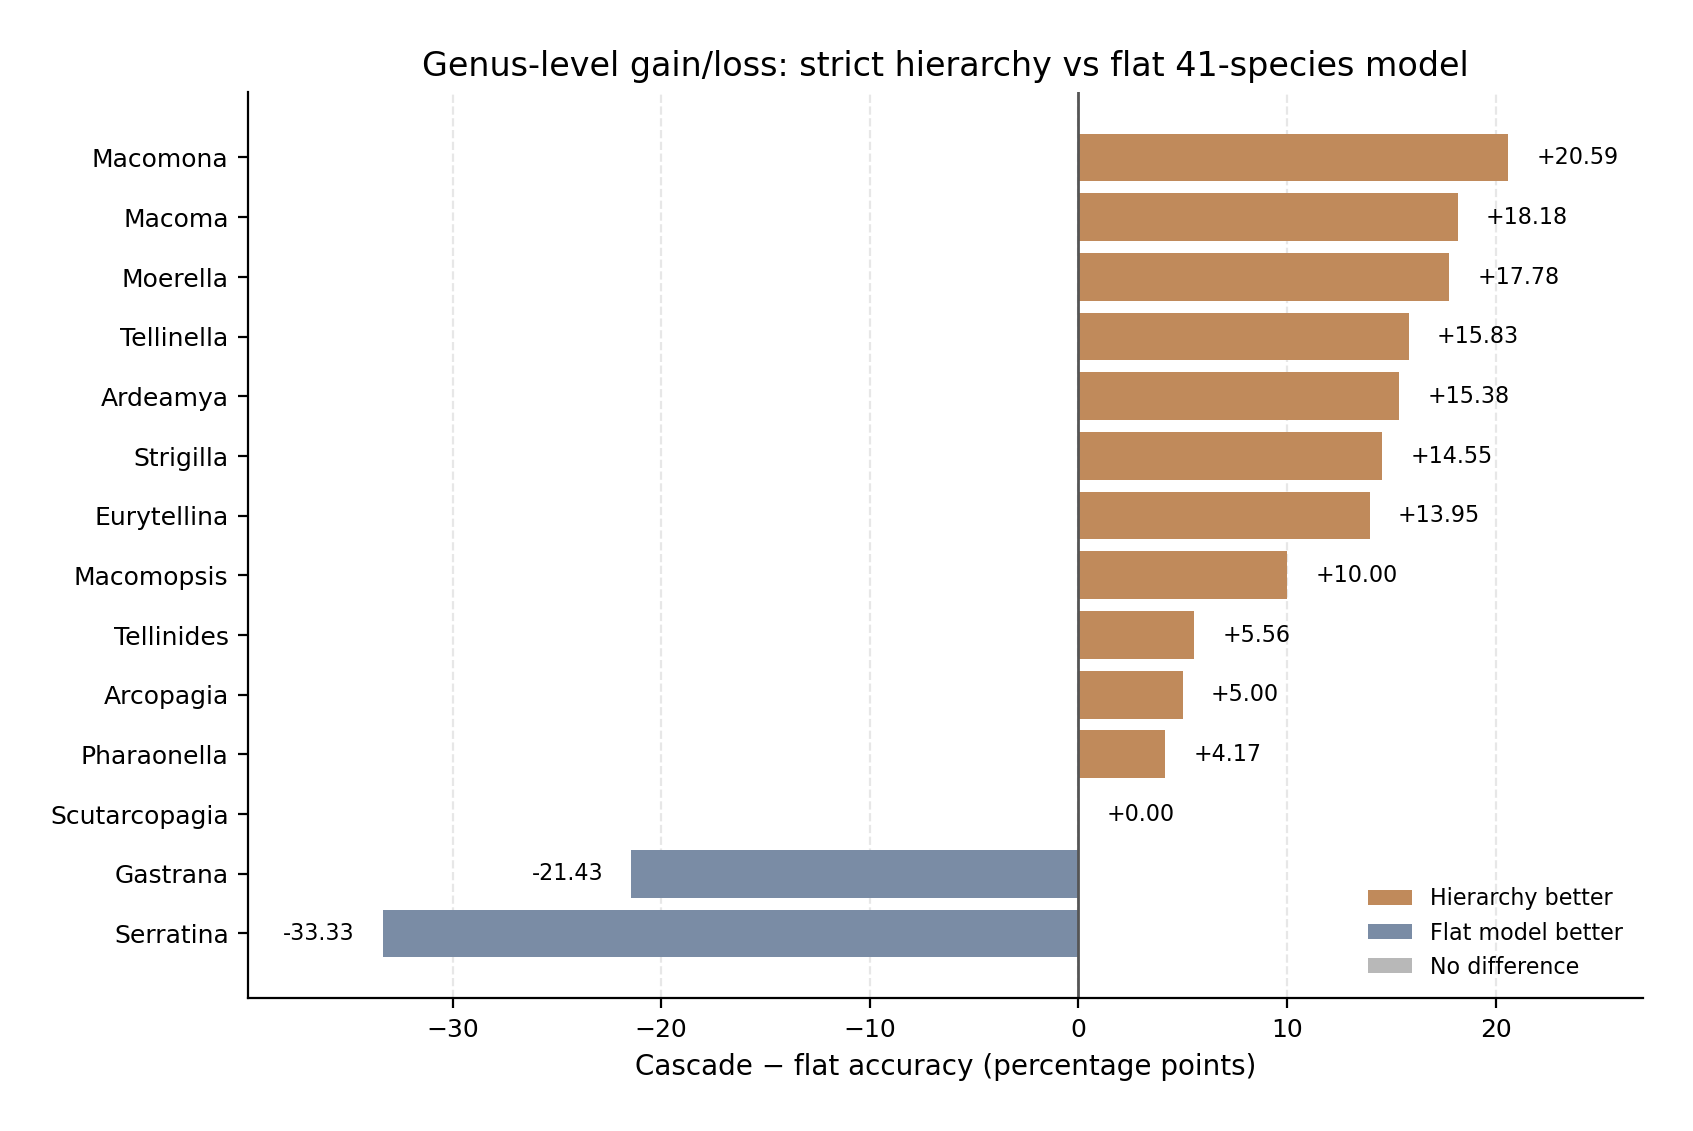
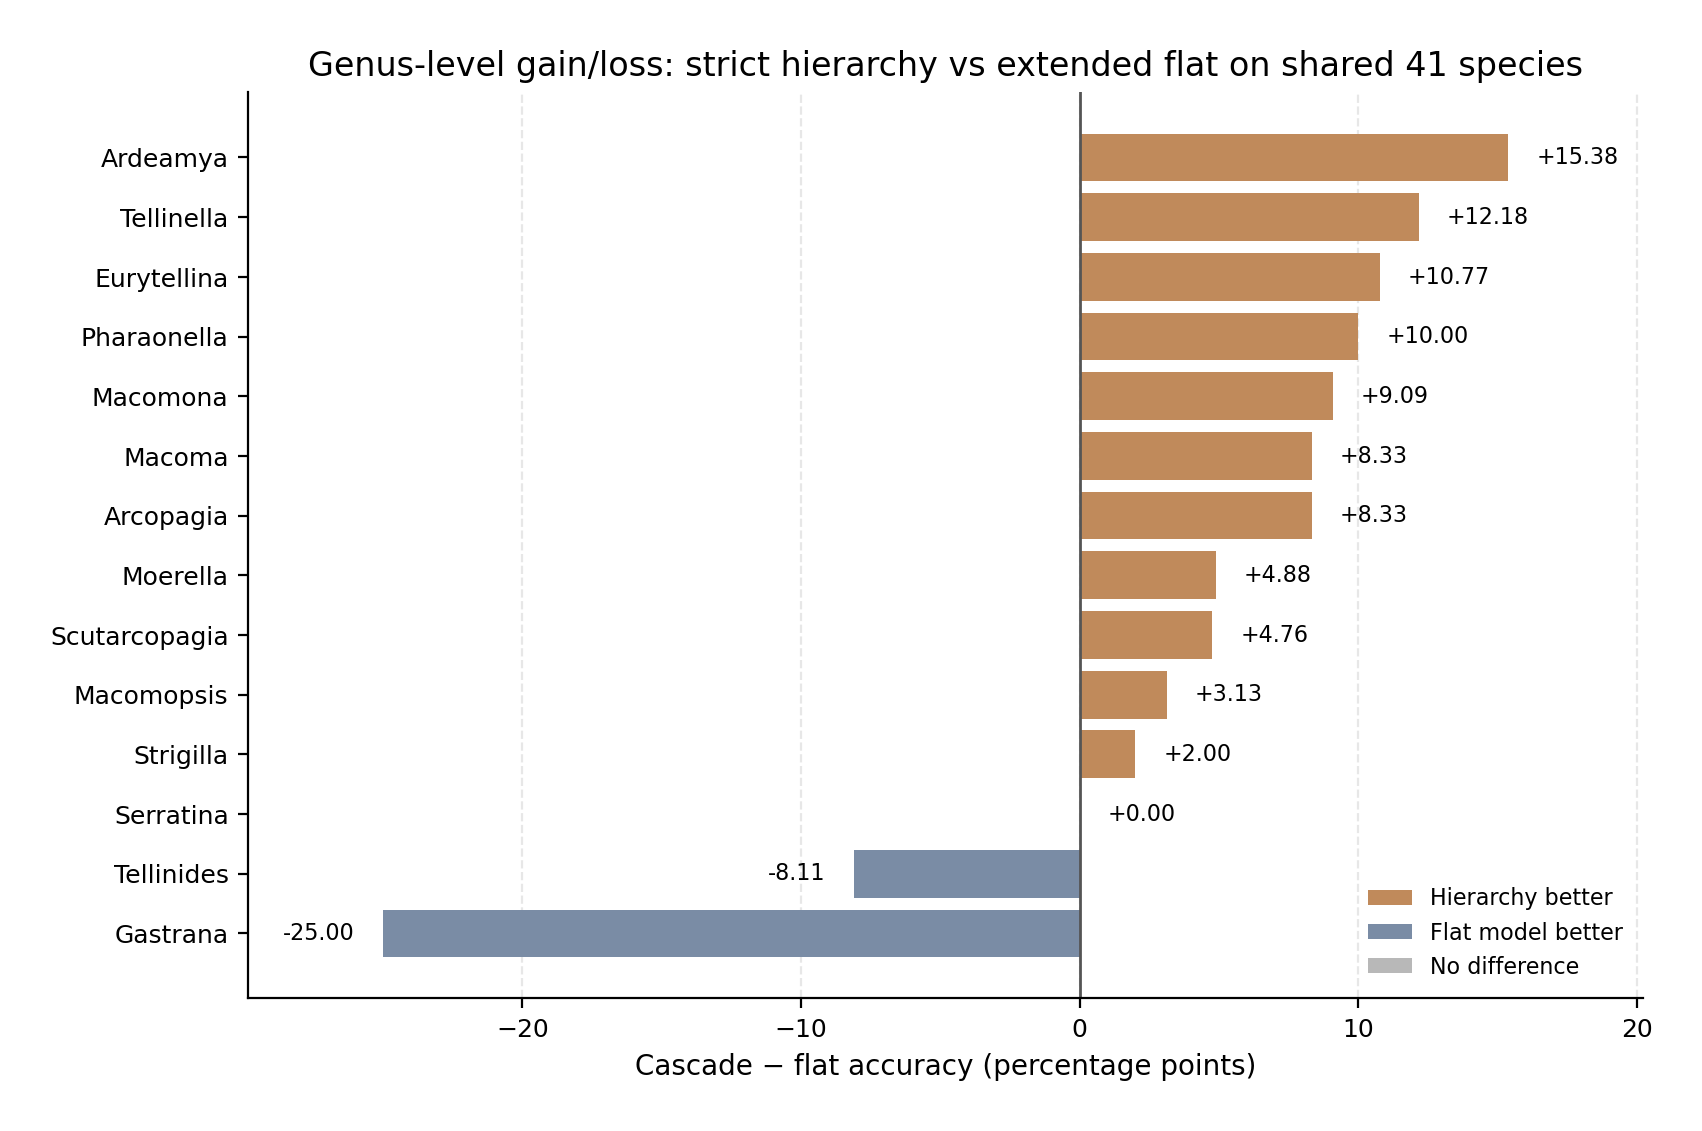
The reference set contained 614 test images from the extended 55-species flat model, filtered to the shared 41-species subset. On this subset, the extended flat model classified 541 images correctly, corresponding to an accuracy of 88.11%. The Family→Genus router selected the correct genus for 607 of the 614 images, giving a genus-routing accuracy of 98.86% on the same images. The strict Family→Genus→Species cascade classified 577 images correctly at species level, corresponding to an accuracy of 93.97%. Figure 4 compares the paired image-level outcomes for both replay analyses, while Figure 5 shows the genus-level gain or loss from strict hierarchical routing. Full genus-level paired metrics are provided in Tables S2 and S3.
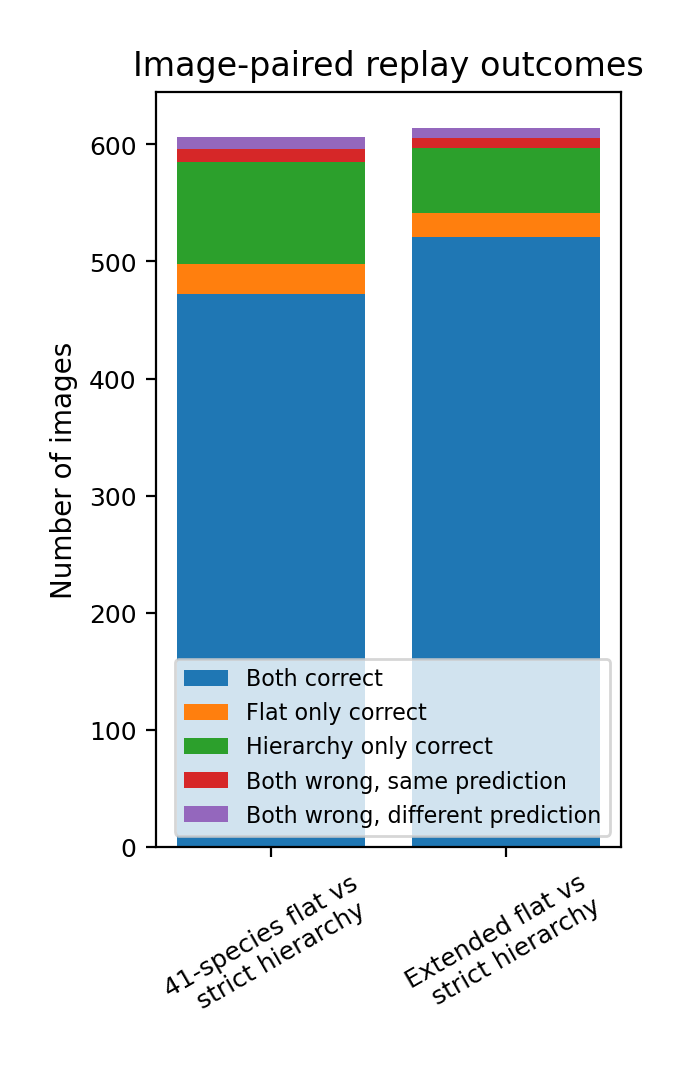
Bars show how many test images were correctly classified by both routes, by the flat route only, by the strict cascade only, or by neither route. In both paired comparisons, the strict Family→Genus→Species cascade produced more unique correct predictions than the corresponding flat model, supporting the conclusion that genus-first routing improved species-level identification when evaluated on the same images.
Thus, even against the stronger extended flat model, the strict hierarchy improved final species-level accuracy by 5.86 percentage points. The paired image-level comparison showed that 521 images were correctly classified by both routes. The extended flat model alone was correct for 20 images, whereas the strict cascade alone was correct for 56 images. Both routes were wrong for 17 images: in 8 cases they produced the same wrong prediction, and in 9 cases they produced different wrong predictions. McNemar’s exact test on the discordant cases showed that the cascade advantage remained statistically significant, with 20 flat-only correct cases versus 56 cascade-only correct cases (p = 4.37 × 10⁻⁵).
The genus-level pattern was again mostly favourable to the hierarchy. The strict cascade improved accuracy in 11 of the 14 genera, was equal to the extended flat model in Serratina, and was lower in Tellinides and Gastrana. The largest gains were observed in Ardeamya (+15.38 percentage points), Tellinella (+12.18), Eurytellina (+10.77), Pharaonella (+10.00), Macomona (+9.09), Arcopagia (+8.33), and Macoma (+8.33). These gains were smaller than in the comparison with the corrected 41-species flat model, because the extended flat model was already stronger on the shared species subset. Nevertheless, the hierarchy still provided a clear operational advantage.
The two negative cases were taxon-specific. In Gastrana, the extended flat model was correct for all 28 reference images, whereas the cascade was correct for 21 images. The genus router selected Gastrana correctly for all images, so the loss was caused by the downstream Gastrana specialist, especially failure on Gastrana fragilis. In Tellinides, the extended flat model was also very strong, reaching 100% accuracy on 37 images, while the cascade reached 91.89%. This loss was associated with Tellinides striatus and Tellinides timorensis. In contrast, Serratina was equal between the two routes, with both reaching 95.83% accuracy.
At species level, the hierarchy helped several species that were less well recovered by the extended flat model, including Ardeamya tokunagai, Macoma calcarea, Eurytellina lineata, Tellinella tithonia, Scutarcopagia linguafelis, Eurytellina angulosa, Moerella distorta, Macoma nasuta, and Tellinella virgata. The main species-level losses were concentrated in Gastrana fragilis, Tellinides striatus, Serratina capsoides, Strigilla chroma, and Tellinides timorensis.
This second replay is important because it separates two questions. The extended flat model is clearly a stronger flat baseline than the corrected 41-species flat model, but it does not remove the benefit of the strict hierarchy on the shared 41-species label space. The result therefore supports the interpretation that genus-level decomposition provides real operational value for the multi-species Tellinidae genera, provided that the genus router is reliable and the relevant specialist is not a genus-specific bottleneck.
|
|
|
Figure 5. Genus-level gain or loss from strict hierarchical routing. Bars show the difference in species-level accuracy between the strict Family→Genus→Species cascade and the corresponding flat Family→Species comparator for each genus. Positive values indicate genera where the hierarchy improved species identification; negative values indicate genera where the flat model performed better. A, comparison with the flat 41-species model. B, comparison with the extended flat model restricted to the shared 41-species subset. The hierarchy improved most genera in both comparisons, but the benefit was not uniform; losses were concentrated in genera where the downstream specialist was weaker than the flat model. | |
Extended genus-first routing for the 55-species label space
The extended 55-species label space requires a different interpretation from the 41-species strict hierarchy. In the 41-species comparison, all included genera contained at least two eligible species, so every final species prediction required two decisions: first Family→Genus routing, then classification by a Genus→Species specialist. In the extended 55-species set, this is no longer true for all genera. Several additional genera are represented by only one species that met the minimum image threshold in the present dataset. For those genera, the genus prediction is terminal within the current label space: if the router correctly predicts the genus, the species label is determined directly. The extended route is therefore not a strict two-stage hierarchy for all 55 species, but a mixed genus-first identification strategy. The components of the extended 55-species genus-first route are summarized in Table 8.
The extended route should therefore be interpreted as a mixed genus-first identification strategy rather than as a strict two-stage hierarchy for all taxa. For genera represented by more than one eligible species, the route remains hierarchical: the image is first assigned to a genus and then classified by the corresponding Genus→Species specialist. For genera represented by one eligible species, the route ends at the genus prediction, because no within-genus species choice is required in the current model configuration.
| Component | Genera | Species | Test images | Accuracy | Interpretation |
|---|---|---|---|---|---|
| 27-genus Family→Genus router | 27 | — | 1,202 | 96.26% | First-stage router covering all genera represented in the extended 55-species model. |
| Multi-species genera requiring Genus→Species specialists | 15 | 43 | — | — | True hierarchical classification: genus routing followed by within-genus species classification. |
| New Ameritella Genus→Species specialist | 1 | 2 | 52 | 100.00% | New specialist required for the extended route; no specialist-stage errors in this run. |
| Genera represented by one eligible species | 12 | 12 | — | — | Terminal genus decision: within the current label space, a correct genus prediction directly determines the species label. |
| Extended genus-first route | 27 | 55 | — | Mixed route | Feasible mixed genus-first deployment structure; not used as the primary test of hierarchical species discrimination because part of the 55-species route terminates at genus level. |
To support this broader genus-first route, a new Family→Genus router was trained for all 27 genera represented in the extended 55-species model. This 27-genus router used 8,772 genus-labelled images and reached 96.26% test accuracy on 1,202 test images, with a weighted F1-score of 96.29%. The result shows that genus-level routing remains strong after expanding the router from the original 14 genera to the full 27-genus label space. However, this result should be interpreted as router performance, not as final full-route species performance.
The extended genus-first route also requires a new downstream specialist for Ameritella, because Ameritella is the only newly added genus represented by two eligible species in the extended 55-species label space. The Ameritella Genus→Species specialist classified all 52 test images correctly, giving 100% test accuracy in this model run. This indicates that Ameritella does not currently appear to be a species-level bottleneck for the extended route.
The remaining added genera are represented by one eligible species in the present 55-species label space. For these genera, the operational question is not whether a specialist can separate species within the genus, but whether the 27-genus router can recover the correct genus reliably. Several of these genera were strongly recovered by the router, including Bathytellina, Bosemprella, Dallitellina, Limecola, Phylloda, Quidnipagus, Rexithaerus, and Tellina. Weaker or more uncertain cases included Megangulus, Fabulina, Peronaea, and Macomangulus. Some of these estimates are based on small test supports, so they should be interpreted cautiously.
A full 55-species genus-first replay could still be useful as a deployment metric, because it would estimate how the complete operational system behaves across all retained Tellinidae species. However, it would not be equivalent to the strict 41-species hierarchy tested above. In the extended 55-species label space, 12 genera are represented by only one eligible species, so a correct genus prediction directly determines the species label for those genera. The resulting full-route accuracy would therefore combine two mechanisms: true Genus→Species classification for multi-species genera, and terminal genus-level assignment for genera represented by one eligible species. For this reason, the extended route is treated here as a mixed genus-first deployment strategy, while the shared 41-species replay remains the primary test of whether hierarchical decomposition improves species discrimination.
Error structure and visual overlap among Tellinidae genera
The genus-level error structure was examined using the prediction records from the Family→Genus routers. In this analysis, each off-diagonal prediction represents a case where an image from one genus was assigned to another genus. These errors are useful because they identify regions of the Tellinidae image space where genus-level shell appearance was not fully separated by the CNN. They should not be read as formal taxonomic evidence; they are model-derived indicators of visual overlap in the present image dataset. The main repeated confusion pairs are listed for the 14-genus router in Table 9 and for the 27-genus router in Table 10.
In the restricted 14-genus router, 32 of 1,020 test images were assigned to the wrong genus, corresponding to an error rate of 3.14%. The errors were not evenly distributed. The largest number of genus-level errors involved Tellinella, which accounted for 11 misrouted images as the true genus. The strongest undirected confusion pairs were Ardeamya–Tellinella (5 errors), Eurytellina–Tellinella (4), Moerella–Tellinella (4), Eurytellina–Serratina (3), Scutarcopagia–Tellinella (3), and Macomona–Serratina (3). Thus, even in the smaller 14-genus space, the remaining errors were concentrated in a limited number of genus pairs rather than being spread randomly across all genera.
| Genus pair | Main direction(s) | Total errors |
|---|---|---|
| Ardeamya – Tellinella | Tellinella→Ardeamya = 3; Ardeamya→Tellinella = 2 | 5 |
| Eurytellina – Tellinella | Tellinella→Eurytellina = 4 | 4 |
| Moerella – Tellinella | Tellinella→Moerella = 2; Moerella→Tellinella = 2 | 4 |
| Eurytellina – Serratina | Serratina→Eurytellina = 3 | 3 |
| Scutarcopagia – Tellinella | Tellinella→Scutarcopagia = 2; Scutarcopagia→Tellinella = 1 | 3 |
| Macomona – Serratina | Serratina→Macomona = 2; Macomona→Serratina = 1 | 3 |
The extended 27-genus router showed a similar pattern at broader taxonomic coverage. It misclassified 45 of 1,202 test images, corresponding to an error rate of 3.74%. These 45 errors were distributed across 33 directional confusion types and 31 undirected genus pairs. The largest true-genus contributors to the error count were Eurytellina (7 errors), Moerella (5), Macomangulus (4), and Megangulus, Peronaea, Dallitellina, and Strigilla with 3 errors each.
The strongest undirected confusion in the 27-genus router was Eurytellina–Moerella, with four errors split symmetrically between the two directions. Other repeated confusion pairs included Dallitellina–Pharaonella (3), Ardeamya–Eurytellina (3), Fabulina–Macomangulus (3), Moerella–Tellinides (2), Megangulus–Tellinella (2), Ameritella–Fabulina (2), Strigilla–Rexithaerus (2), and Eurytellina–Fabulina (2). Several additional pairs occurred once, including Megangulus–Rexithaerus, Peronaea–Pharaonella, Peronaea–Serratina, Peronaea–Moerella, and Macomangulus–Serratina.
| Genus pair | Main direction(s) | Total errors |
|---|---|---|
| Eurytellina – Moerella | Eurytellina→Moerella = 2; Moerella→Eurytellina = 2 | 4 |
| Dallitellina – Pharaonella | Dallitellina→Pharaonella = 3 | 3 |
| Ardeamya – Eurytellina | Eurytellina→Ardeamya = 3 | 3 |
| Fabulina – Macomangulus | Macomangulus→Fabulina = 2; Fabulina→Macomangulus = 1 | 3 |
| Moerella – Tellinides | Moerella→Tellinides = 2 | 2 |
| Megangulus – Tellinella | Megangulus→Tellinella = 2 | 2 |
| Ameritella – Fabulina | Ameritella→Fabulina = 2 | 2 |
| Strigilla – Rexithaerus | Strigilla→Rexithaerus = 2 | 2 |
| Eurytellina – Fabulina | Eurytellina→Fabulina = 2 | 2 |
Some genera were more often selected as false-positive predictions than their own recall alone would suggest. Fabulina was the most frequent false-positive predicted genus in the 27-genus router, receiving eight images from other genera: Ameritella, Bathytellina, Bosemprella, Eurytellina, and Macomangulus. This explains why Fabulina had high recall but lower precision in the per-genus metrics. Pharaonella showed a similar but smaller pattern, receiving false-positive images mainly from Dallitellina and Peronaea.
Taken together, the confusion structure indicates that the Tellinidae genus routers do not fail uniformly. Most genera are recovered with high reliability, but residual errors concentrate in recurring visual-overlap zones. In the 14-genus model, the main overlap involved Tellinella, Ardeamya, Eurytellina, Moerella, Serratina, Macomona, and Scutarcopagia. In the 27-genus model, the expanded label space added further overlap involving Fabulina, Macomangulus, Megangulus, Rexithaerus, Peronaea, and Dallitellina. These pairs identify the genera where shell-image diagnosability is less clean in the present dataset and where manual review, additional images, or more detailed error analysis would be most informative.
Within-genus dispersion of species-level performance
The Genus→Species specialists differed not only in overall accuracy, but also in how evenly performance was distributed among the species within each genus. To examine this, per-class F1-scores were calculated from the image-level non-balanced prediction records for each specialist. This analysis separates two situations that can have similar aggregate accuracy: genera in which all species are recovered with similar reliability, and genera in which one or a few weak species dominate the errors. Figure 6 summarizes the within-genus dispersion of species-level F1-scores; full dispersion statistics are provided in Table S5.
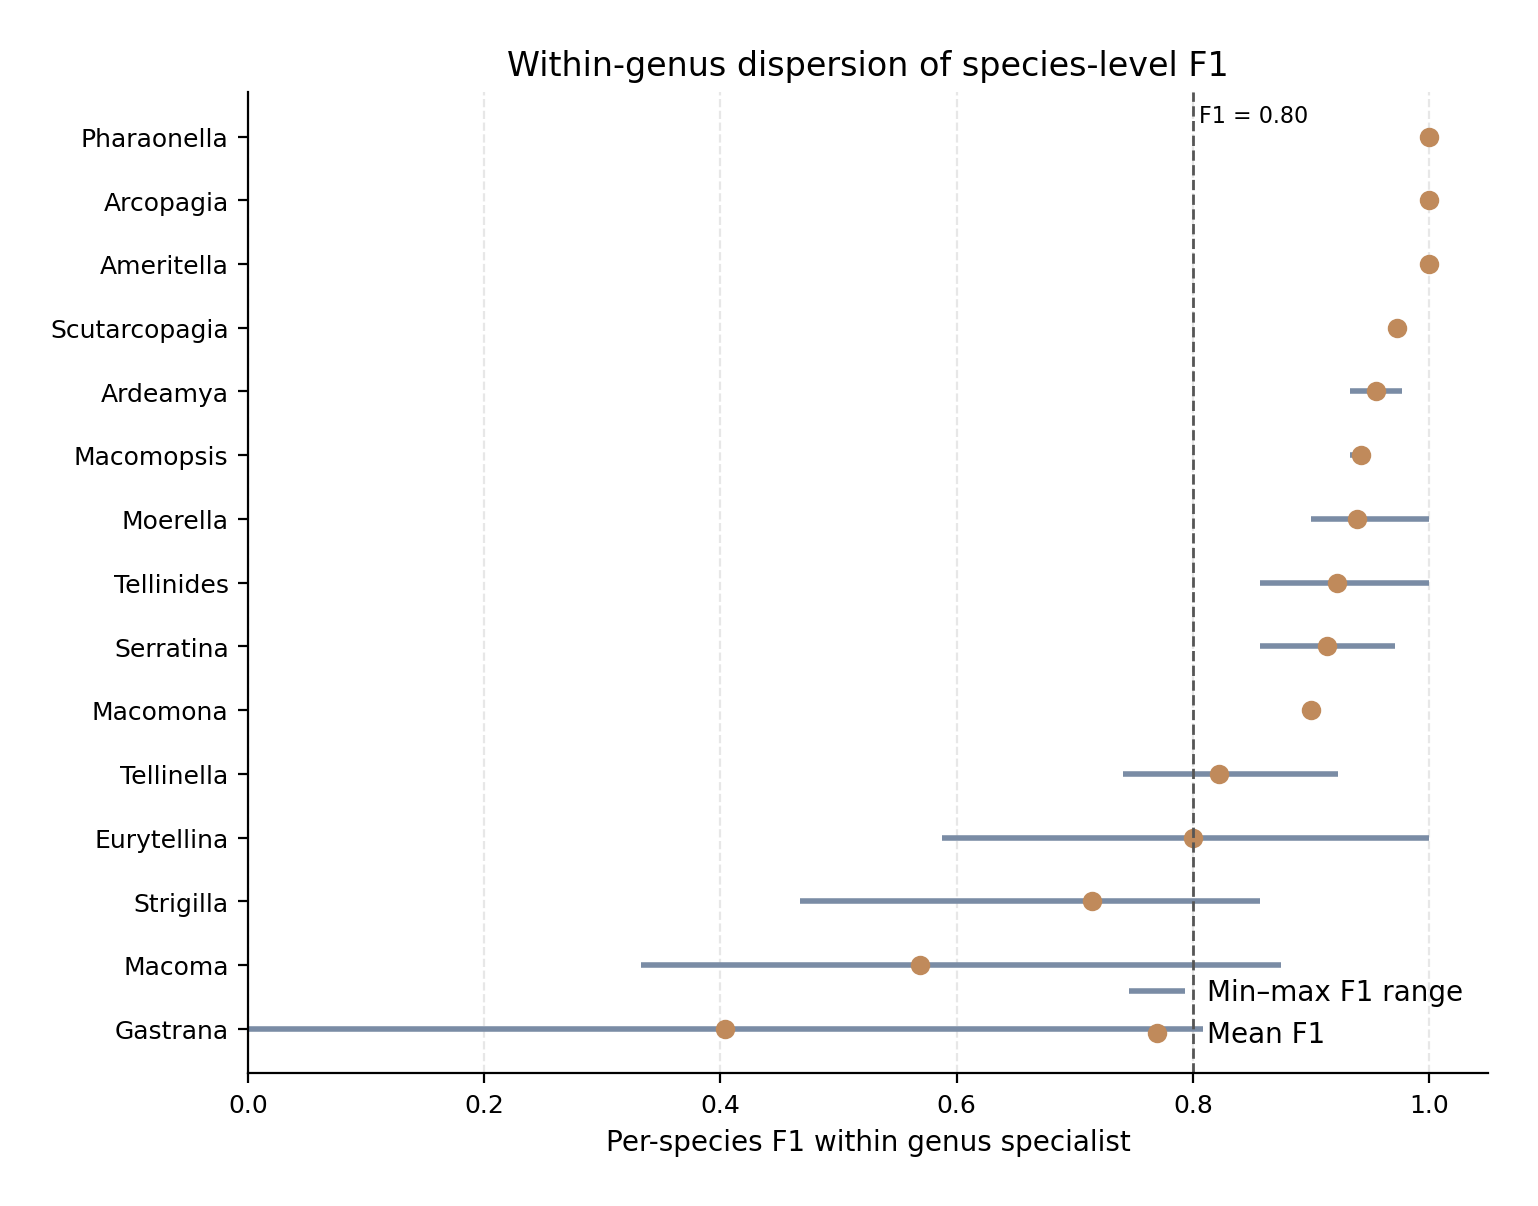
Horizontal lines show the range between the weakest and strongest species-level F1-score within each genus specialist, and points show the mean per-species F1. The dashed vertical line marks F1 = 0.80 as a practical threshold for reduced species-level reliability. Genera such as Ameritella, Arcopagia, Pharaonella, and Scutarcopagia show uniformly high species-level recoverability, whereas Macoma, Gastrana, Strigilla, Eurytellina, and Tellinella show lower or more uneven within-genus performance. The figure distinguishes specialists that are uniformly reliable from specialists whose aggregate accuracy is limited by one or more weak species.
Several specialists showed uniformly high within-genus performance. Ameritella, Arcopagia, and Pharaonella each reached a mean, median, minimum, and maximum per-class F1 of 1.000. These models showed no detectable dispersion in the test records, because both species in each genus were recovered without class-level error. Scutarcopagia was also highly uniform, with mean per-class F1 = 0.973 and both species above 0.95. These genera therefore represent the clearest cases where species were consistently recoverable once the genus was fixed.
A second group showed strong but slightly less uniform performance. Ardeamya, Macomopsis, Moerella, Tellinides, Serratina, and Macomona all had mean per-class F1 values between 0.900 and 0.955. In these genera, the weakest species-level F1 remained above 0.85, and no species fell below 0.80. This indicates that the specialist models were not driven by a single well-classified species while failing on another; rather, performance was relatively stable across the included species.
The most uneven specialists were Tellinella, Eurytellina, Strigilla, Macoma, and Gastrana. Tellinella had a mean per-class F1 of 0.822, with three of five species below 0.80. Eurytellina had a similar mean F1 of 0.800, but with larger dispersion: its weakest class, E. alternata, had F1 = 0.588, while at least one species reached F1 = 1.000. Strigilla showed stronger dispersion still, with mean F1 = 0.715 and a minimum F1 of 0.467 for S. carnaria. Macoma was broadly weak, with mean F1 = 0.569 and three of four species below 0.80. The most extreme case was Gastrana, where G. fragilis had F1 = 0.000 while G. matadoa reached F1 = 0.809, giving a mean per-class F1 of 0.404.
These dispersion patterns are important for interpreting specialist-stage bottlenecks. In some genera, such as Gastrana, the low aggregate result is dominated by one failing species. In others, especially Macoma, weakness is broader and affects most species in the genus. Eurytellina, Tellinella, and Strigilla occupy an intermediate position, with a mixture of recoverable and poorly recovered species. This distinction is operationally useful: a single weak species may be addressed by targeted review or additional data for that class, whereas broad within-genus weakness suggests that the entire specialist model requires closer inspection.
Overall, the within-genus dispersion analysis confirms that genus-level decomposition does not have a uniform effect across Tellinidae. Some genera become highly stable once the decision space is restricted to the genus, while others remain difficult even after genus routing. The main specialist-stage limitations of the hierarchy are therefore concentrated in Macoma, Gastrana, Strigilla, Eurytellina, and Tellinella, while Ameritella, Arcopagia, Pharaonella, and Scutarcopagia show the strongest and most uniform species-level recoverability.
Summary of operational route performance
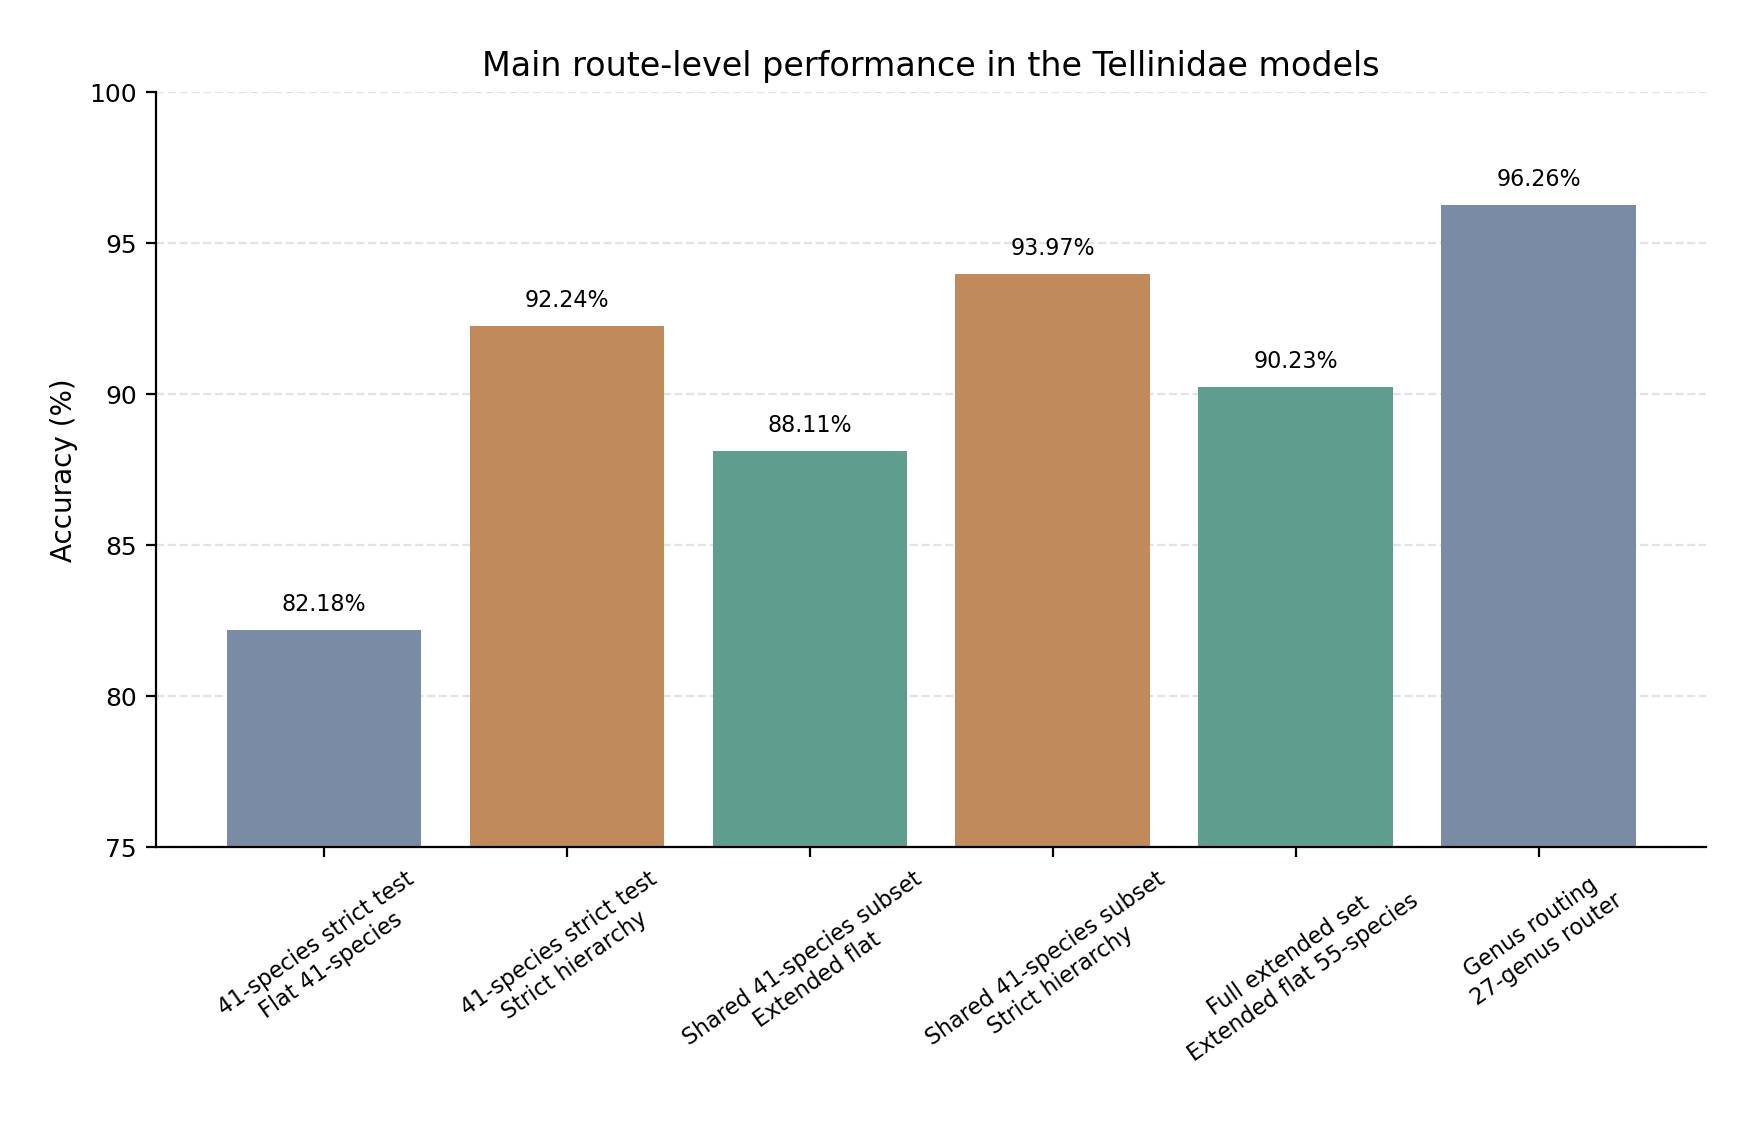
The strict Family→Genus→Species hierarchy achieved higher species-level accuracy than the flat 41-species Family→Species model and also outperformed the extended flat model when both were restricted to the shared 41-species subset. The full 55-species flat model is shown separately because it represents broader taxonomic coverage rather than the same strict hierarchy comparison. Colours distinguish flat routes, strict hierarchical routes, and the extended flat route.
The Tellinidae model series shows that the best operational route depends on the taxonomic scope being considered. For the 41-species set, where all genera contain at least two eligible species, the strict Family→Genus→Species hierarchy was the strongest route. In the image-paired replay, the 41-species flat Family→Species model reached 82.18% accuracy, whereas the strict hierarchy reached 92.24%. The cascade therefore improved final species accuracy by 10.07 percentage points, with a statistically significant paired advantage over the flat route. The main route-level accuracies are compared visually in Figure 7, and the corresponding numerical summary is provided in Table 11.
The extended 55-species flat model provided broader taxonomic coverage and a stronger direct species-level baseline than the corrected 41-species flat model. Across all 55 species, the extended flat model reached 90.23% accuracy and 90.39% weighted F1. This shows that direct Family→Species classification can scale to the broader Tellinidae label space without a general loss of performance. However, when the extended flat model was restricted to the 41 species shared with the strict hierarchy, it still remained below the hierarchical route: 88.11% for the extended flat model versus 93.97% for the strict cascade. Thus, the extended flat model narrowed the performance gap but did not remove the advantage of genus-level decomposition on the shared multi-species genera.
| Route / comparison | Genera | Species | Test images | Accuracy |
|---|---|---|---|---|
| Corrected flat Family→Species model, 41-species set | 14 | 41 | 606 | 82.18% |
| Strict Family→Genus→Species hierarchy, 41-species replay | 14 | 41 | 606 | 92.24% |
| Extended flat Family→Species model, all retained species | 27 | 55 | 1,197 | 90.23% |
| Extended flat Family→Species model, restricted to shared 41 species | 14 | 41 | 614 | 88.11% |
| Strict Family→Genus→Species hierarchy on shared 41-species subset | 14 | 41 | 614 | 93.97% |
| Extended 27-genus Family→Genus router | 27 | — | 1,202 | 96.26% |
| Preferred operational interpretation | 27 | 55 | — | — |
The genus-first strategy is therefore strongly supported for genera where more than one eligible species must be separated. The main reason is the high reliability of genus routing. In the 41-species replay, the Family→Genus router selected the correct genus for 99.17% of images. In the comparison using the extended flat model restricted to the same 41 species, genus-routing accuracy was again high, at 98.86%. Because routing errors were rare, the genus specialists were able to improve species discrimination in most genera without introducing enough routing loss to offset their benefit.
The extended 55-species setting requires a more cautious interpretation. A new 27-genus router was trained to cover all genera represented in the extended flat model and reached 96.26% test accuracy. Together with the new Ameritella specialist, this makes an extended genus-first route feasible. However, this route is not equivalent to the strict 41-species hierarchy, because 12 genera in the 55-species label space are represented by only one eligible species. For those genera, genus prediction is terminal and directly determines the species label in the current model. The extended route is therefore best described as a mixed operational strategy: true hierarchical classification for multi-species genera and terminal genus-level assignment for genera represented by one eligible species.
Overall, the results support a route-dependent deployment strategy rather than a single universal classifier. For the 41 species belonging to multi-species genera, the strict hierarchy is the preferred operational route. For broader Tellinidae coverage, the extended 55-species flat model remains valuable because it includes genera not present in the original hierarchy. The most practical future implementation is therefore an extended genus-first system: use Family→Genus routing as the first step, apply a Genus→Species specialist when the predicted genus contains multiple eligible species, and return the only eligible species when the predicted genus is terminal in the current label space. The main caveat is that specialist-stage weaknesses remain in several genera, especially Macoma, Gastrana, Strigilla, Eurytellina, and Tellinella, so these genera should be prioritized for further review and model improvement.
Discussion
Genus-first routing is operationally useful for multi-species genera
The principal operational result of this study is that a genus-first identification route was more effective than direct species-level classification for the multi-species Tellinidae genera examined here. In the strict 41-species comparison, the Family→Genus→Species hierarchy reached 92.24% species-level accuracy, compared with 82.18% for the flat Family→Species model. The same conclusion held when the stronger extended flat model was restricted to the shared 41-species subset: the hierarchy reached 93.97%, whereas the extended flat model reached 88.11%. Thus, the advantage of the hierarchical route was not simply an artefact of comparing against a weak flat baseline; it remained present even when the flat comparator was trained in the broader 55-species setting. The most important conclusion is therefore that, for genera represented by multiple eligible species, genus-first routing provides a real operational advantage [25, 26].
This result is notable because strict hierarchical classification is not automatically expected to improve performance. A hierarchical system introduces a potential hard-error mechanism: if the first-stage genus router selects the wrong genus, the correct species is no longer available to the downstream specialist [25, 27]. In many cascaded classification systems, this routing risk can offset the apparent benefit of decomposing a large label space into smaller subproblems. In the present Tellinidae models, however, routing error was sufficiently rare that this disadvantage remained small. In the 41-species replay, the Family→Genus router selected the correct genus for 99.17% of images, and in the shared-subset comparison it remained similarly reliable at 98.86%. As a result, most images were passed to the appropriate Genus→Species specialist, allowing the second-stage model to operate within a much smaller and biologically constrained decision space.
The benefit of this decomposition is biologically plausible. Tellinid taxonomy has long relied on shell characters such as outline, posterior flexure, hinge dentition, sculpture, pallial sinus configuration, and other aspects of shell architecture, even though the taxonomic interpretation of these characters has changed substantially over time [4, 3, 5]. A genus-level classifier can exploit relatively broad shell-form differences among genera, while the downstream specialists only need to distinguish species within a restricted genus-level context. In this sense, the hierarchy matches a common taxonomic workflow: first identify the broader morphological group, then resolve the finer species-level alternatives within that group. The strong genus-router performance suggests that, under the image conditions used here, many Tellinidae genera have sufficient visual coherence to be recovered reliably from standardized shell images.
The result should not be interpreted as evidence that hierarchical classification is universally superior for Tellinidae. Its success depends on two conditions being met simultaneously: the genus router must be highly reliable, and the relevant genus-level specialist must improve species discrimination. Both conditions were largely satisfied in the 41-species setting, which explains the strong overall gain. However, the Results also show that specialist-stage performance was uneven across genera. Some genera became highly stable once the decision space was restricted to the genus, whereas others remained difficult even after correct routing. The operational value of genus-first classification is therefore strongest for multi-species genera in which genus-level morphology is reliably recovered and species-level specialists are not themselves major bottlenecks.
This finding also has a useful biological interpretation. The CNN results suggest that Tellinidae shell morphology contains a strong genus-level visual signal, but that species-level diagnosability is more variable. This is consistent with the broader systematic context of Tellinidae, where shell morphology remains indispensable for identification but is also affected by functional adaptation, homoplasy, and taxonomic instability [7, 9, 6]. The hierarchy does not prove that current genera are phylogenetically natural units, nor does it resolve the known molecular instability of tellinoid classification. Rather, it shows that the current genus labels are often visually recoverable from shell images and can be used as effective operational partitions for species identification.
For practical deployment in IdentifyShell.org, these results support a route-dependent strategy. For genera represented by more than one eligible species, the preferred route should be genus-first: apply the Family→Genus model, then use the corresponding Genus→Species specialist. For broader Tellinidae coverage, the extended flat Family→Species model remains valuable as a broad comparator and fallback, especially for genera not yet supported by strong specialists. However, the main operational conclusion is clear: when the genus router is reliable, genus-first routing reduces the effective species decision space and improves final species identification for multi-species Tellinidae genera. These route-level results are summarized in Figure 7 and Table 11.
Biological interpretation: visual diagnosability of Tellinidae genera and species
The model results can be interpreted as a morphology-based diagnostic benchmark for Tellinidae. The aim is not to infer phylogeny directly from CNN predictions, but to test how consistently current taxonomic labels can be recovered from standardized shell images. In this sense, high classification performance indicates that the available images contain a stable and repeatable visual signal for a taxon, whereas weak or uneven performance identifies taxa for which shell-image diagnosability is limited. This interpretation is consistent with earlier reports, where CNN performance, embedding structure, outlier behaviour, and interpretability analyses were used to evaluate how reliably shell morphology is expressed in image space rather than only to report classifier accuracy [28, 29]
Conversely, weak or uneven performance should not be interpreted simply as model failure. It may reflect insufficient or unbalanced image data, poor views, damaged or juvenile specimens, label noise, or source-specific photographic effects. More biologically, it may also indicate high intraspecific variation, subtle interspecific separation, phenotypic plasticity, or convergence in shell form. These possibilities are especially relevant in Tellinidae, where traditional identification depends on shell outline, posterior flexure, hinge dentition, sculpture, pallial sinus characters, and related shell features, but where morphology is also shaped by infaunal life habits and functional constraints [4, 3, 9].
The difficult genera in this study are therefore biologically informative. Genera such as Macoma, Gastrana, Strigilla, Eurytellina, and Tellinella should be treated as visual-diagnostic bottlenecks rather than simply as low-performing classes. In some cases, the weakness may be concentrated in one or two species, suggesting a targeted data or label problem. In other cases, low performance across several species may indicate that the genus occupies a broad or overlapping shell morphospace, or that the diagnostic characters needed for reliable separation are not consistently visible in the available images. This distinction is important because the remedy is different: a single problematic species may require additional images or expert relabelling, whereas broad within-genus weakness may require additional views, morphometric analysis, locality information, or molecular validation.
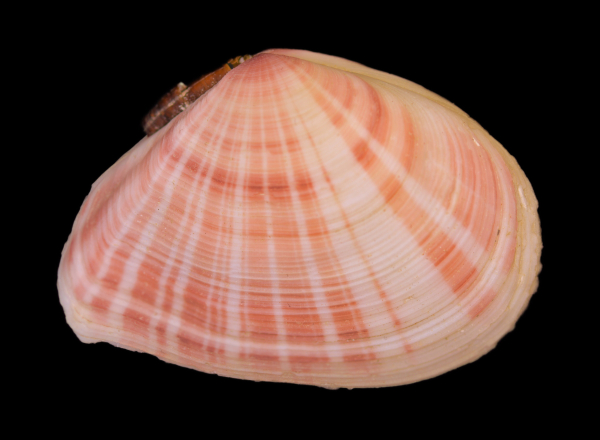
This interpretation is supported by external work showing that shell morphology can contain measurable taxonomic signal but may also be insufficient on its own. Geometric morphometric work on Macominae showed that shell-shape analysis can separate some visually similar tellinid species and relate shell form to life habit, but it also reinforces that continuous shell characters often require quantitative treatment rather than simple visual inspection [19]. More broadly, recent deep-learning work on bivalve specimen images found that image-derived morphology can recover higher-level taxonomic affinity and correlate with genetic distance, but that fine-grained relationships remain more difficult and should not be overinterpreted as phylogeny [30].
The distinction between visual diagnosability and phylogenetic validity is particularly important for Tellinidae because recent molecular work has challenged several traditional shell-based groupings. Denser mitogenomic sampling supports the monophyly of Tellinoidea but indicates that Semelidae nests within Tellinidae in the sampled mitogenomic topology, while recent UCE-based phylogenomics further emphasizes instability in traditional tellinoid family limits [6, 18]. Therefore, a CNN result should be read as evidence about the recoverability of current labels from shell morphology, not as evidence that those labels define natural clades. Strong CNN performance means that the taxon is visually coherent in the present image domain; weak performance means that shell-image evidence alone is insufficient or unstable for that taxon.
This interpretation is consistent with a wider body of image-based organism-identification work. In insects, Valan et al. [31] showed that transfer learning from pretrained CNNs can achieve expert-level taxonomic identification with relatively small training sets, demonstrating that diagnostic morphology can be recovered from images even when the number of examples per class is limited. Similarly, Spiesman et al. [32] trained CNNs to classify 36 North American bumble bee species and framed automated species recognition as a way to reduce the taxonomic bottleneck in ecological monitoring. These studies support the general premise that CNN performance can be read not only as a technical result, but also as evidence that some taxa have visually recoverable, repeatable diagnostic features in image space
However, the broader literature also shows why strong performance must be interpreted cautiously. Camera-trap work by Norouzzadeh et al. [33] demonstrated that CNNs can identify, count, and describe wild animals at large scale, but the biological usefulness of such systems depends strongly on confidence thresholding and on knowing when automated classification should abstain. This is directly relevant to Tellinidae: weak genera or uncertain species should not necessarily receive forced species-level assignments, because the model may be encountering images where shell morphology is insufficient, obscured, or outside the reliable training domain [27].
Within bivalves, Hofmann et al. [30] provide the closest external parallel because they explicitly asked whether specimen images can recover taxonomic affinities and genetic distances. Their work supports the idea that image-derived morphology can contain biologically meaningful taxonomic signal, while also cautioning that fine-scale relationships are more difficult than higher-level affinity. The Tellinidae results fit this pattern: genus-level routing was highly reliable, suggesting that broad shell-form structure is often recoverable, whereas species-level performance was more uneven, especially in genera such as Macoma, Gastrana, Strigilla, Eurytellina, and Tellinella.
A further caution is that visual signal is not automatically biological signal. Shell-image models can learn acquisition-related cues such as background, lighting, cropping style, source, ruler fragments, or other photographic conventions. Previous work on studio versus field imagery emphasized that controlled images help CNNs focus on intrinsic shell characters such as geometry, colour pattern, and texture, but also warned that models can exploit shortcut features if these are correlated with class labels [29]. For this reason, the biological interpretation of Tellinidae performance is strongest for taxa that remain well recovered across sources, views, and image conditions, and weakest where performance may depend on source-specific image style.
Taken together, the Tellinidae results support a nuanced conclusion: shell images contain substantial diagnostic information, but this information is not evenly distributed across the family. Some taxa are visually compact and strongly recoverable, while others remain ambiguous even after genus-level restriction. The CNN results therefore provide a practical identification benchmark and a biological map of visual diagnosability. They identify where shell morphology is sufficient for reliable image-based recognition, where the current image set needs improvement, and where shell-only identification should be supplemented by additional evidence such as alternative views, morphometrics, expert review, locality data, or molecular markers.
Specialist-stage bottlenecks limit the uniform benefit of the hierarchy
The superior performance of the strict Family→Genus→Species route should not be interpreted as evidence that hierarchical classification is uniformly beneficial for every Tellinidae genus. The hierarchy improved overall species-level accuracy because the first-stage genus router was highly reliable and because most genus-level specialists reduced the effective species decision space. However, a hierarchical classifier has two distinct failure points. The first is routing failure, where the image is assigned to the wrong genus and the correct species is no longer available to the downstream classifier. The second is specialist-stage failure, where the genus is correctly predicted but the corresponding Genus→Species model does not separate the species reliably. In the present study, the first failure mode was limited, whereas the second remained important.
This distinction explains why the hierarchy was strong overall but not uniformly superior. In the 41-species replay, routing error was rare, so the main limitation was not the Family→Genus decision. Instead, the remaining errors were concentrated in specific downstream specialists. Gastrana and Serratina were the clearest negative exceptions in the strict 41-species comparison: in these genera, the flat model performed better than the hierarchical route because the genus specialist was weaker than the broader flat classifier. This is operationally important because it shows that a correct genus prediction is only useful if the corresponding specialist has learned a reliable species boundary. A hierarchy can reduce confusion by narrowing the label space, but it can also amplify local weaknesses when a specialist has insufficient data, uneven class representation, poor views, or intrinsically subtle species-level morphology. The uneven specialist-stage pattern is visible in Figures 2, 3, and 6.
The specialist results therefore refine the biological interpretation developed above. Strong specialists such as Ameritella, Arcopagia, Pharaonella, Scutarcopagia, Ardeamya, and several others suggest that, once the genus is fixed, their included species possess sufficiently stable shell-image signals to be separated reliably. By contrast, Macoma, Gastrana, Strigilla, Eurytellina, and Tellinella remained the principal species-level bottlenecks. These genera should not simply be described as “difficult models”; they should be treated as taxa where shell-image diagnosability is limited under the current imaging protocol. In some cases, the weakness appears concentrated in a single species, as with Gastrana fragilis, suggesting a targeted problem of image number, image quality, label consistency, or missing diagnostic views. In other cases, such as Macoma, weakness was broader across multiple species, suggesting that shell-only separation may be intrinsically more difficult or that the standard external views do not capture the characters required for reliable identification.
This pattern is biologically plausible for Tellinidae. Tellinid identification has traditionally relied on shell outline, posterior flexure, sculpture, hinge characters, lateral teeth, and pallial sinus configuration, but these characters are not always equally visible in standard shell photographs and are not always exclusive at species level [4, 5, 3]. Comparative anatomical work has also shown that internal morphology can contain important systematic information not captured by shell outline alone [9]. Therefore, specialist-stage weakness may indicate that the image set lacks the particular anatomical or positional information needed to distinguish certain species. For some genera, exterior shell form may be sufficient; for others, interior views, hinge close-ups, locality information, morphometrics, or molecular data may be needed.
The weak specialists are also consistent with the broader systematic difficulty of Tellinidae. Modern molecular and phylogenomic studies have challenged several traditional shell-based groupings, including the classical separation of Macominae and Tellininae, and have shown that tellinoid family and subfamily limits are more complex than earlier morphology-based classifications suggested [17, 6]. This does not mean that poor CNN performance proves taxonomic instability in a particular genus. Rather, it means that CNN weakness should be interpreted cautiously: it may reflect data limitations, but it may also identify taxa where shell morphology is conservative, homoplastic, plastic, or incompletely represented in the available photographs. In this respect, the weak specialists are scientifically informative because they mark the boundary between taxa that are visually recoverable from shell images and taxa that require additional evidence.
This conclusion is in line with previous work. Earlier hierarchical CNN reports emphasized that top-down taxonomic routing is useful only when early-stage classifiers are reliable, because errors at a routing node can become irrecoverable downstream [25, 26]. The present Tellinidae results show the complementary situation: routing was sufficiently reliable, but the downstream specialist stage remained the limiting factor in selected genera. The Epitoniidae modelling report [34] reached a similar broader conclusion: CNN performance is strongest when the target group is visually cohesive and declines when the taxonomic group is morphologically broader, internally heterogeneous, or represented by uneven image data. Likewise, the embedding and outlier analyses [28] showed that weak or unstable predictions can be used to identify taxa and specimens requiring curation rather than being treated only as classification errors.
The practical implication is that deployment should be genus-specific rather than uniform. For genera with strong specialists, the hierarchical route can be used confidently as the preferred operational path. For genera with weak specialists, a forced hierarchical species assignment should be treated more cautiously. In these cases, the system should retain the flat-model output as a comparator, apply genus-specific confidence thresholds, and consider returning a lower-rank identification or requesting expert review when the specialist confidence is low. Confidence-aware automation has been important in other organism-identification systems, such as camera-trap classification, where automated predictions are most useful when uncertain cases can be withheld from automatic assignment rather than forced into a potentially wrong class [33].
The main conclusion of this section is therefore not that the hierarchy failed in these genera, but that the hierarchy revealed where the current image-based species boundaries are weakest. The strong overall cascade result supports genus-first routing as the preferred route for multi-species Tellinidae genera, but the specialist-stage bottlenecks define the next priorities for improvement. Macoma, Gastrana, Strigilla, Eurytellina, Tellinella, and the weaker species within otherwise acceptable specialists should be prioritized for image audit, additional views, source-held-out testing, morphometric comparison, and, where possible, molecular or expert taxonomic validation. This would convert the remaining errors from a limitation of the model into a targeted research and curation agenda.
Genus-level confusion reveals visual-overlap zones, not taxonomic conclusions
The genus-level confusion structure provides only a secondary line of evidence in this study. Both Family→Genus routers performed strongly overall, and the absolute number of routing errors was small: 32 errors in the 14-genus router and 45 errors in the 27-genus router. For this reason, individual confusion pairs should not be overinterpreted. Repeated pairs such as Ardeamya–Tellinella, Eurytellina–Tellinella, Eurytellina–Moerella, Fabulina–Macomangulus, and Dallitellina–Pharaonella are best treated as preliminary indicators of local visual overlap in the present image domain, not as robust biological or taxonomic patterns.
This caution is especially important in Tellinidae, where shell morphology is informative but not a direct proxy for phylogeny. Similar shell forms may reflect common ancestry, retained ancestral characters, convergence, functional constraints associated with infaunal life, or simply the limited set of views available in standardized shell photographs [4, 7, 8]. Recent molecular and phylogenomic studies also show that traditional tellinoid groupings can be unstable, so CNN confusion should not be read as evidence that confused genera are closely related or taxonomically misplaced [6, 17, 18]. The confusion pairs therefore identify where the model found shell images difficult to separate, not where the taxonomy should be revised.
The practical value of the confusion analysis is mainly curatorial. Genera involved in repeated errors can be prioritized for image audit, source-bias checks, and inspection of high-confidence wrong predictions. Some apparent overlaps may disappear after removing mislabeled images, duplicate source styles, poor views, or acquisition artefacts. Where confusion persists after such checks, additional approaches such as alternative shell views, geometric morphometrics, interpretability analysis, locality data, or molecular evidence may help determine whether the overlap reflects genuine morphological ambiguity or limitations of the current image representation [19, 28, 29, , 30] Thus, the genus-confusion results should be used as a guide for future review rather than as a central biological conclusion of the report.
Coverage versus route reliability in operational deployment
The route comparison should not be interpreted as a simple choice between a flat model and a hierarchy. The strict 41-species Family→Genus→Species hierarchy is the best-tested route for genera represented by multiple eligible species, because it combines highly reliable genus routing with specialist models that usually improve species-level separation. However, this strict hierarchy does not cover the full extended Tellinidae label space.
The extended 55-species flat model therefore remains operationally important. It provides broader taxonomic coverage across 27 genera, including additional genera represented by one eligible species in the present dataset. Although it was less accurate than the strict hierarchy on the shared 41-species subset, it covers taxa that are not all resolved by the original strict hierarchical route. Its role is therefore not replaced by the hierarchy; rather, it provides broad coverage and a useful comparator for route-level decisions.
This distinction is important because the extended 55-species genus-first route is not a pure hierarchy in the same sense as the 41-species comparison. For multi-species genera, the route tests true hierarchical species discrimination: the model must first recover the correct genus and then separate species within that genus. For genera represented by one eligible species in the present label space, however, the route tests genus recognition followed by deterministic species assignment. A full 55-species genus-first replay would therefore be useful as a deployment metric, but it should not replace the shared 41-species replay as the cleanest test of whether hierarchical decomposition improves species-level classification.
Limitations of the present image-based benchmark
The present study should be interpreted as an image-based benchmark of shell diagnosability, not as a balanced biological survey of Tellinidae. The dataset was assembled from available online shell images, including specialist shell websites, institutional resources, GBIF, online marketplaces, and other image collections. As a result, the taxonomic and geographic composition of the dataset reflects image availability, collecting history, source practices, and taxonomic labelling quality rather than balanced sampling of Tellinidae diversity. The inclusion thresholds also shaped the final label space: genera and species with too few available images were excluded, and species-level specialists required a minimum number of images per class. Consequently, absence from the model should not be interpreted as biological absence or taxonomic unimportance.
A second limitation concerns the structure of the extended 55-species label space. Several added genera were represented by only one eligible species in the current dataset. These genera are therefore single-representative genera operationally, not necessarily monospecific biological genera. For such taxa, a correct genus prediction can determine the species label within the current model, but this is a consequence of the dataset and label space, not a statement about the real diversity of the genus. Some performance estimates also have limited support. For example, genera with small test sets in the 27-genus router, such as Megangulus and Pharaonella, should be interpreted cautiously because a small number of errors can strongly affect recall, precision, and F1-score.
Finally, the models use shell images only. They cannot evaluate characters absent from the image, including soft-part anatomy, hinge details not visible in external views, pallial sinus morphology when interiors are not shown, locality, ecology, reproductive biology, or DNA sequence divergence. This is especially important in Tellinidae, where shell morphology is informative but also affected by convergence, phenotypic plasticity, functional constraints, and unresolved systematics. The results are therefore specific to the present image domain: standardized, mostly curated shell images. Performance may differ for field photographs, juvenile specimens, damaged or beach-worn shells, unusual orientations, mixed-specimen images, or images with non-standard lighting and backgrounds. These limitations do not invalidate the results, but they define the scope of the conclusions: the models measure visual recoverability from the available shell images, not the full taxonomic or biological distinctiveness of Tellinidae taxa.
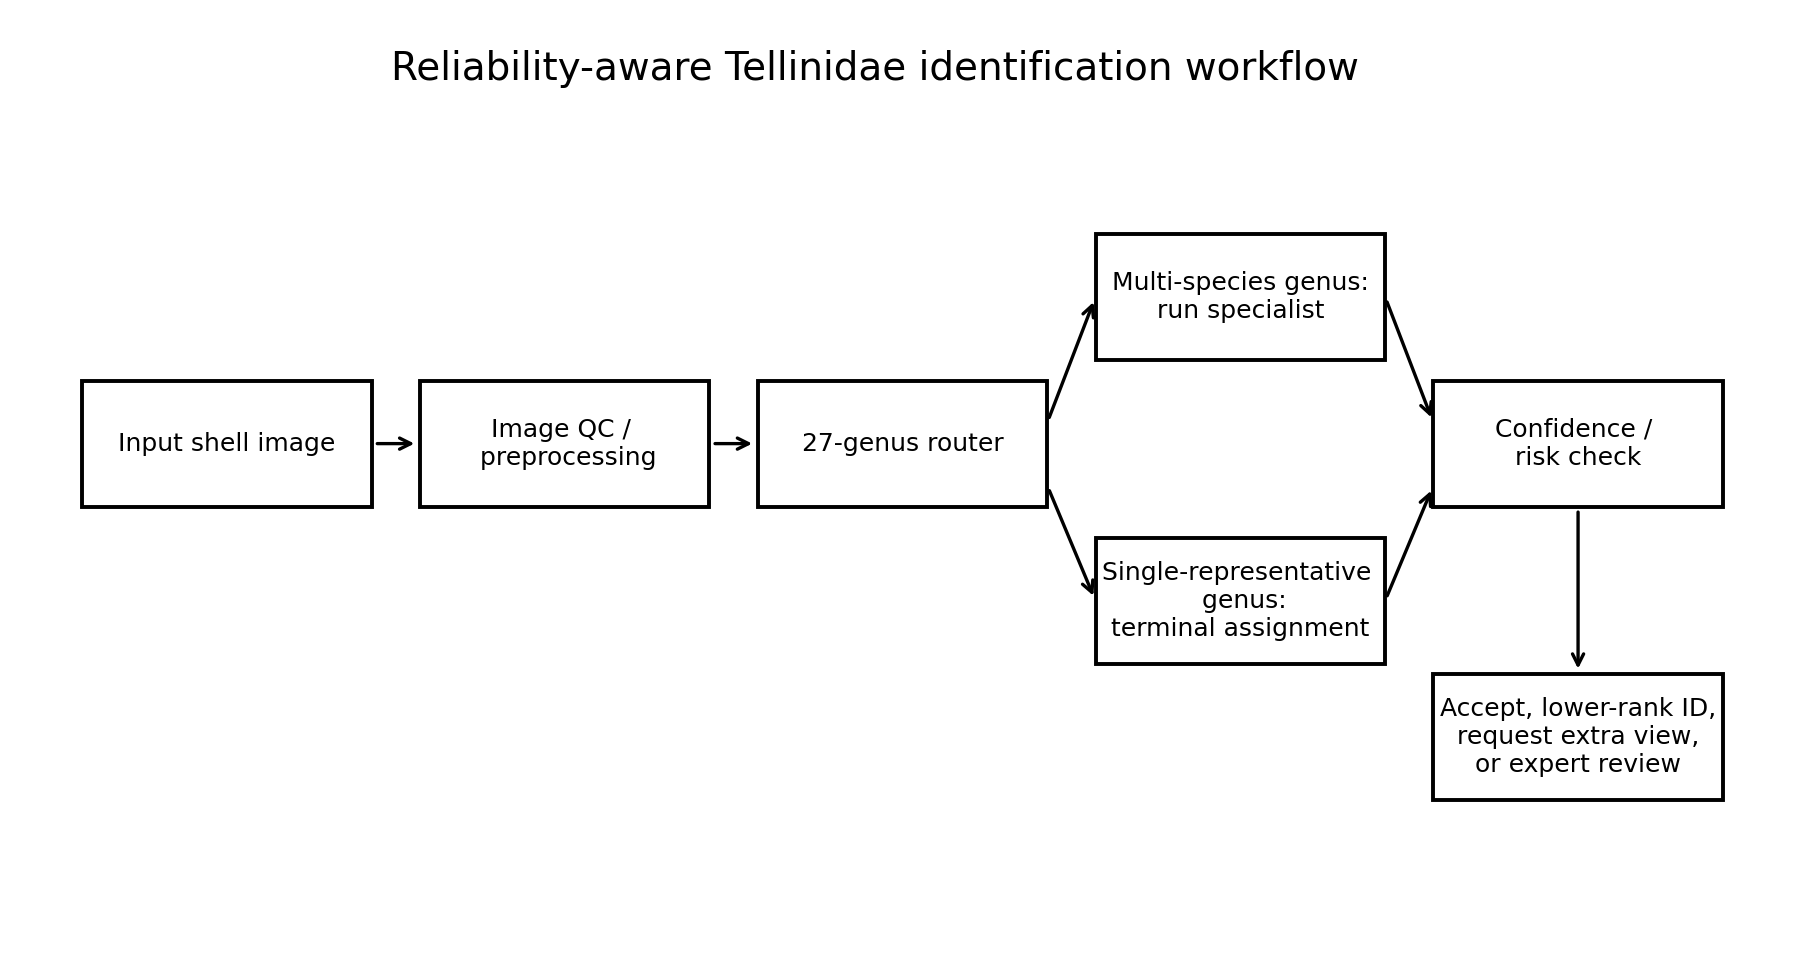
Proposed deployment workflow for the extended Tellinidae genus-first system. After image quality control and preprocessing, the image is routed through the 27-genus Family→Genus model. Multi-species genera are passed to the corresponding Genus→Species specialist, whereas genera represented by one eligible species in the current label space receive terminal genus-based assignment. Final predictions should be filtered through confidence and risk checks, allowing the system to accept reliable identifications, return a lower-rank result, request an additional view, or flag the case for expert review.
Future work: from route comparison to reliability-aware identification
The next step is not simply to train larger models, but to make Tellinidae identification more reliable and interpretable. The first priority should be targeted review of weak classes and recurrent error cases. Species and genera identified as specialist-stage bottlenecks, especially Macoma, Gastrana, Strigilla, Eurytellina, Tellinella, and weaker classes such as Gastrana fragilis, Macoma calcarea, Macoma incongrua, and Strigilla carnaria, should be inspected image by image. High-confidence wrong predictions are particularly important, because they may reveal mislabeled images, source artefacts, atypical specimens, juvenile or damaged shells, or genuine visual similarity between taxa. A proposed reliability-aware deployment workflow is shown in Figure 8.
A second priority is to improve the evidence base for weak and low-support taxa. Additional curated images should be added for poorly represented species and genera, especially where test-set support is small or performance is unstable. However, adding images should be combined with curation rather than treated as a purely quantitative solution. For some taxa, the problem may not be the number of images alone, but the absence of diagnostic views. Interior views, hinge close-ups, paired valve views, locality information, size, and specimen metadata may be needed where external shell shape is insufficient for reliable separation.
Future validation should also test whether the models are learning shell morphology rather than source-specific image style. Source-held-out validation would be especially useful, because the present dataset is assembled from heterogeneous online image sources. If performance remains strong when entire sources, suppliers, or photographic styles are withheld, the biological interpretation of the model becomes stronger. If performance declines sharply, then part of the apparent diagnostic signal may reflect background, lighting, cropping, labelling, or collection-specific image conventions rather than shell characters.
Interpretability analyses should be added for the main correct and incorrect prediction groups. Grad-CAM, occlusion tests, or related methods can be used to test whether the models attend to biologically meaningful shell regions such as outline, posterior flexure, sculpture, colour pattern, hinge region, or shell margins, rather than to non-biological artefacts [29]. This would make the link between CNN performance and shell-based diagnosability more explicit. For difficult taxa, geometric morphometrics and comparison with image-derived embeddings may also help determine whether the observed visual overlap reflects continuous shell-shape variation, insufficient views, or possible taxonomic complexity [19, 30].
Finally, deployment should move from route comparison toward reliability-aware identification. The genus-first route is the preferred structure for the current Tellinidae implementation, but predictions should be accompanied by confidence thresholds, genus-specific caution flags, and abstention rules for weak specialists. The system should not always force a species-level answer when the model is uncertain or when the predicted genus belongs to a known bottleneck group. Instead, it can return a lower-rank identification, request additional views, or flag the case for expert review. Metadata such as locality, size, habitat, and source can be used as external support signals, but should complement rather than replace morphology-based inference. In this way, the Tellinidae models can evolve from a route-comparison experiment into a practical, reliability-aware identification system.
References
- [1] WoRMS/MolluscaBase Tellinidae Blainville, 1814. https://www.marinespecies.org/aphia.php?p=taxdetails&id=235 https://www.molluscabase.org/aphia.php?p=taxdetails&id=235 (accessed 18 May, 2026)
- [2] H M D de Blainville. Sur la classification méthodique des animaux mollusques, et établissement d'une nouvelle considération pour y parvenir. Bulletin des Sciences, par la Société Philomatique de Paris. 1814: 175-180 (1814)
- [3] M Huber, A Langleit, K Kreipl. Tellinidae. Pp. 167-297, 564-746. In: M. Huber, Compendium of bivalves 2 A full-color guide to the remaining seven families. A systematic listing of 8,500 bivalve species and 10,500 synonyms.. Harxheim: ConchBooks. 907 pp. (2015)
- [4] CM Yonge. On the structure and adaptations of the Tellinacea, deposit-feeding Eulamellibranchia. Philosophical Transactions of the Royal Society B 234: 29–76 (1949)
- [5] P M Mikkelsen & R Bieler. Seashells of Southern Florida: Bivalves. Princeton University Press. Book Chapter (2008)
- [6] W Tang, T Xu, J Gong & L Kong. Denser Mitogenomic Sampling for Exploring the Phylogeny of Tellinoidea (Mollusca: Bivalvia). Diversity 17: 303 (2025)
- [7] S M Stanley. Relation of Shell Form to Life Habits of the Bivalvia (Mollusca). Geological Society of America Memoir 125 (1970)
- [8] R Pohle. Evolution of the Tellinacea (Bivalvia). Journal of Molluscan Studies 48: 245-256 (1982)
- [9] L R L Simone & S Wilkinson. Comparative morphological study of some Tellinidae from Thailand (Bivalvia: Tellinoidea). Raffles Bulletin of Zoology Suppl. 18: 151–190 (2008)
- [10] A G Stephen. Notes on the Biology of Tellina tenuis da Costa. Journal of the Marine Biological Association of the United Kingdom 15: 683–702 (1928)
- [11] A Trevallion, A D Ansell & P Sivadas. Studies on Tellina tenuis da Costa I. Seasonal growth and biochemical cycle. Journal of Experimental Marine Biology and Ecology 1: 220-235 (1967)
- [12] A Trevallion. Studies in the bivalve, Tellina tenuis Da Costa. IV. Further experiments in enriched sea water. Journal of Experimental Marine Biology and Ecology 11: 189–206 (1973)
- [13] J Wilson. The burrowing of Tellina tenuis and Tellina fabula in relation to sediment characteristics. Journal of Life Sciences R. Dublin Soc. 1, 91-98 (1979)
- [14] L Zwarts & J H Wanink. How the food supply harvestable by waders in the Wadden Sea depends on the variation in energy density, body weight, biomass, burying depth and behaviour of tidal-flat invertebrates. Netherlands Journal of Sea Research 31 (4), 441-476 (1993)
- [15] P de Goeij & P J C Honkoop. The effect of immersion time on burying depth of the bivalve Macoma balthica (Tellinidae). Journal of Sea Research 47: 109–119 (2002)
- [16] P de Goeij & P J C Honkoop. Experimental effects of immersion time and water temperature on body condition, burying depth and timing of spawning of the tellinid bivalve Macoma balthica. Helgoland Marine Research 57: 20–26 (2003)
- [17] J D Taylor et al. A molecular phylogeny of heterodont bivalves (Mollusca: Bivalvia: Heterodonta): new analyses of 18S and 28S rRNA genes. Zoologica Scripta 36 (6), 587-606 (2007)
- [18] A R Batistao et al. Ultraconserved element-based phylogenomics and siphonal traits illuminate the evolution of tellinoidean clams (Mollusca: Bivalvia: Tellinoidea). Zoological Journal of the Linnean Society, Volume 205, Issue 3 (2025)
- [19] T A Marinho & E P Arruda. Shell-specific differentiation: how geometric morphometrics can add to knowledge of Macominae species (Tellinidae, Bivalvia). Marine Biodiversity 51: 40 (2021)
- [20] D García-Souto, G Ríos & J J Pasantes. Karyotype differentiation in tellin shells (Bivalvia: Tellinidae). BMC Genetics 18: 66 (2017)
- [21] S Sun et al. DNA barcoding reveal patterns of species diversity among northwestern Pacific molluscs. Scientific Reports volume 6, 33367 (2016)
- [22] E Pante et al. SNP detection from de novo transcriptome sequencing in the bivalve Macoma balthica: marker development for evolutionary studies. PLoS ONE 7(12): e52302 (2012)
- [23] V Becquet et al. Glacial refugium versus range limit: conservation genetics of Macoma balthica, a key species in the Bay of Biscay. Journal of Experimental Marine Biology and Ecology 432–433: 73–82 (2012)
- [24] A Saunier et al. Mitochondrial genomes of the Baltic clam Macoma balthica(Bivalvia: Tellinidae): setting the stage for studying mito-nuclear incompatibilities. BMC Evol Biol 14, 259 (2014)
- [25] Ph Kerremans. Hierarchical CNN to identify Mollusca. IdentifyShell.org Blog. (2025)
- [26] Ph Kerremans. Optimizing Molluscan CNN Taxonomy: Balancing Hierarchy Simplification, Data Volume, and Augmentation for Improved Classification. IdentifyShell.org Blog. (2025)
- [27] Ph Kerremans. Building a New Family-Level Model: Why Generalization Matters. IdentifyShell.org Blog. (2025)
- [28] Ph Kerremans. Analyzing Intra- and Inter-Class Variability and Detecting Outliers in CNN Seashell Image Classification Models. IdentifyShell.org Blog. (2025)
- [29] Ph Kerremans. Unveiling Morphological Insights in Biological Imagery Through CNN Interpretability Techniques. IdentifyShell.org Blog. (2025)
- [30] M Hofmann et al. Inferring Taxonomic Affinities and Genetic Distances Using Morphological Features Extracted from Specimen Images: A Case Study with a Bivalve Data Set. Syst Biol. 73(6):920-940 (2024)
- [31] M Valan et al. Automated Taxonomic Identification of Insects with Expert-Level Accuracy Using Effective Feature Transfer from Convolutional Networks. Systematic Biology, 68, 6, 876–895 (2019)
- [32] B J Spiesman et al. Assessing the potential for deep learning and computer vision to identify bumble bee species from images. Scientific Reports 11, 7580 (2021)
- [33] M S Norouzzadeh et al. Automatically identifying, counting, and describing wild animals in camera-trap images with deep learning. Proc. Natl. Acad. Sci. U.S.A. 115 (25) E5716-E5725 (2018)
- [34] Ph Kerremans. Epitoniidae: Scientific Background, Hierarchical CNN Modelling, and Performance of One Family-Level and Six Genus-Level Models. IdentifyShell.org Blog. (2026)
- [35] Zhang, Q., Zhou, J., He, J. et al. A shell dataset, for shell features extraction and recognition.. Nature, Sci Data 6, 226 (2019)
- [36] Ph. Kerremans Identifying Shells using Convolutional Neural Networks: Data Collection and Model Selection. IdentifyShell.org (2024)
Supplementary tables
| Genus | Genus images | Species | Species images | ||||
|---|---|---|---|---|---|---|---|
| Ameritella | 131 | Ameritella agilis | 85 | ||||
| Ameritella modesta | 46 | ||||||
| Arcopagia | 131 | Arcopagia crassa | 90 | ||||
| Arcopagia fausta | 41 | ||||||
| Ardeamya | 145 | Ardeamya petitiana | 96 | ||||
| Ardeamya tokunagai | 49 | ||||||
| Bathytellina | 209 | Bathytellina citrocarnea | 209 | ||||
| Bosemprella | 308 | Bosemprella incarnata | 308 | ||||
| Dallitellina | 376 | Dallitellina rostrata | 376 | ||||
| Eurytellina | 389 | Eurytellina alternata | 32 | ||||
| Eurytellina angulosa | 53 | ||||||
| Eurytellina inaequistriata | 41 | ||||||
| Eurytellina lineata | 120 | ||||||
| Eurytellina punicea | 143 | ||||||
| Fabulina | 153 | Fabulina fabula | 153 | ||||
| Gastrana | 143 | Gastrana fragilis | 36 | ||||
| Gastrana matadoa | 107 | ||||||
| Limecola | 372 | Limecola balthica | 372 | ||||
| Macoma | 164 | Macoma calcarea | 35 | ||||
| Macoma incongrua | 35 | ||||||
| Macoma moesta | 37 | ||||||
| Macoma nasuta | 57 | ||||||
| Macomangulus | 362 | Macomangulus tenuis | 362 | ||||
| Macomona | 152 | Macomona deltoidalis | 61 | ||||
| Macomona liliana | 91 | ||||||
| Macomopsis | 176 | Macomopsis cumana | 105 | ||||
| Macomopsis melo | 71 | ||||||
| Megangulus | 39 | Megangulus bodegensis | 39 | ||||
| Moerella | 238 | Moerella distorta | 65 | ||||
| Moerella donacina | 98 | ||||||
| Moerella pulchella | 35 | ||||||
| Moerella tulipa | 40 | ||||||
| Peronaea | 144 | Peronaea planata | 144 | ||||
| Pharaonella | 98 | Pharaonella astula | 52 | ||||
| Pharaonella aurea | 46 | ||||||
| Phylloda | 395 | Phylloda foliacea | 395 | ||||
| Quidnipagus | 182 | Quidnipagus palatam | 182 | ||||
| Rexithaerus | 162 | Rexithaerus secta | 162 | ||||
| Scutarcopagia | 188 | Scutarcopagia linguafelis | 66 | ||||
| Scutarcopagia scobinata | 122 | ||||||
| Serratina | 107 | Serratina capsoides | 41 | ||||
| Serratina serrata | 66 | ||||||
| Strigilla | 265 | Strigilla carnaria | 80 | ||||
| Strigilla chroma | 65 | ||||||
| Strigilla dichotoma | 47 | ||||||
| Strigilla sincera | 73 | ||||||
| Tellina | 121 | Tellina radiata | 121 | ||||
| Tellinella | 646 | Tellinella cruciata | 171 | ||||
| Tellinella cumingii | 69 | ||||||
| Tellinella philippii | 73 | ||||||
| Tellinella tithonia | 51 | ||||||
| Tellinella virgata | 282 | ||||||
| Tellinides | 190 | Tellinides margaritinus | 68 | ||||
| Tellinides striatus | 53 | ||||||
| Tellinides timorensis | 69 | ||||||
| Total | 5986 | 55 species | 5986 | ||||
| Genus | Images | Species | Flat accuracy | Genus-router accuracy | Cascade accuracy | Cascade − flat | Flat only correct | Cascade only correct |
|---|---|---|---|---|---|---|---|---|
| Macomona | 34 | 2 | 76.47% | 100.00% | 97.06% | +20.59 pp | 0 | 7 |
| Macoma | 33 | 4 | 75.76% | 96.97% | 93.94% | +18.18 pp | 0 | 6 |
| Moerella | 45 | 4 | 82.22% | 100.00% | 100.00% | +17.78 pp | 0 | 8 |
| Tellinella | 139 | 5 | 79.14% | 99.28% | 94.96% | +15.83 pp | 3 | 25 |
| Ardeamya | 26 | 2 | 76.92% | 96.15% | 92.31% | +15.38 pp | 0 | 4 |
| Strigilla | 55 | 4 | 72.73% | 100.00% | 87.27% | +14.55 pp | 5 | 13 |
| Eurytellina | 86 | 5 | 80.23% | 98.84% | 94.19% | +13.95 pp | 4 | 16 |
| Macomopsis | 30 | 2 | 86.67% | 100.00% | 96.67% | +10.00 pp | 0 | 3 |
| Tellinides | 36 | 3 | 88.89% | 100.00% | 94.44% | +5.56 pp | 0 | 2 |
| Arcopagia | 20 | 2 | 80.00% | 100.00% | 85.00% | +5.00 pp | 1 | 2 |
| Pharaonella | 24 | 2 | 91.67% | 100.00% | 95.83% | +4.17 pp | 0 | 1 |
| Scutarcopagia | 29 | 2 | 100.00% | 100.00% | 100.00% | 0.00 pp | 0 | 0 |
| Gastrana | 28 | 2 | 89.29% | 100.00% | 67.86% | −21.43 pp | 6 | 0 |
| Serratina | 21 | 2 | 100.00% | 95.24% | 66.67% | −33.33 pp | 7 | 0 |
| Genus | Images | Species | Extended flat accuracy | Genus-router accuracy | Cascade accuracy | Cascade − flat | Flat only correct | Cascade only correct |
|---|---|---|---|---|---|---|---|---|
| Ardeamya | 26 | 2 | 80.77% | 100.00% | 96.15% | +15.38 pp | 0 | 4 |
| Tellinella | 156 | 5 | 82.05% | 98.08% | 94.23% | +12.18 pp | 3 | 22 |
| Eurytellina | 65 | 5 | 83.08% | 98.46% | 93.85% | +10.77 pp | 1 | 8 |
| Pharaonella | 20 | 2 | 85.00% | 100.00% | 95.00% | +10.00 pp | 0 | 2 |
| Macomona | 33 | 2 | 90.91% | 100.00% | 100.00% | +9.09 pp | 0 | 3 |
| Arcopagia | 36 | 2 | 88.89% | 100.00% | 97.22% | +8.33 pp | 0 | 3 |
| Macoma | 24 | 4 | 87.50% | 100.00% | 95.83% | +8.33 pp | 0 | 2 |
| Moerella | 41 | 4 | 92.68% | 100.00% | 97.56% | +4.88 pp | 1 | 3 |
| Scutarcopagia | 42 | 2 | 95.24% | 100.00% | 100.00% | +4.76 pp | 0 | 2 |
| Macomopsis | 32 | 2 | 96.88% | 100.00% | 100.00% | +3.13 pp | 0 | 1 |
| Strigilla | 50 | 4 | 82.00% | 98.00% | 84.00% | +2.00 pp | 4 | 5 |
| Serratina | 24 | 2 | 95.83% | 95.83% | 95.83% | 0.00 pp | 1 | 1 |
| Tellinides | 37 | 3 | 100.00% | 97.30% | 91.89% | −8.11 pp | 3 | 0 |
| Gastrana | 28 | 2 | 100.00% | 100.00% | 75.00% | −25.00 pp | 7 | 0 |
| Genus specialist | Species classes | Images | Test images | Correct | Incorrect | Train acc. | Val. acc. | Test acc. | Epochs |
|---|---|---|---|---|---|---|---|---|---|
| Ameritella | 2 | 131 | 52 | 52 | 0 | 100.00% | 100.00% | 100.00% | 200 |
| Arcopagia | 2 | 131 | 52 | 52 | 0 | 100.00% | 100.00% | 100.00% | 50 |
| Pharaonella | 2 | 98 | 38 | 38 | 0 | 100.00% | 100.00% | 100.00% | 50 |
| Scutarcopagia | 2 | 188 | 74 | 72 | 2 | 100.00% | 97.30% | 97.30% | 50 |
| Ardeamya | 2 | 145 | 58 | 56 | 2 | 94.83% | 96.55% | 96.55% | 50 |
| Serratina | 2 | 107 | 42 | 40 | 2 | 94.19% | 100.00% | 95.24% | 14 |
| Macomopsis | 2 | 176 | 70 | 66 | 4 | 97.16% | 94.29% | 94.29% | 50 |
| Moerella | 4 | 238 | 94 | 88 | 6 | 95.29% | 93.62% | 93.62% | 117 |
| Tellinides | 3 | 190 | 76 | 70 | 6 | 99.34% | 92.11% | 92.11% | 50 |
| Macomona | 2 | 152 | 60 | 54 | 6 | 94.26% | 90.00% | 90.00% | 139 |
| Tellinella | 5 | 646 | 258 | 216 | 42 | 92.26% | 85.27% | 83.72% | 50 |
| Eurytellina | 5 | 389 | 154 | 122 | 32 | 92.95% | 79.22% | 79.22% | 39 |
| Strigilla | 4 | 265 | 106 | 74 | 32 | 86.32% | 69.81% | 69.81% | 81 |
| Gastrana | 2 | 143 | 56 | 38 | 18 | 91.30% | 67.86% | 67.86% | 20 |
| Macoma | 4 | 164 | 64 | 38 | 26 | 87.12% | 62.50% | 59.38% | 104 |
| Total / aggregate specialist-stage result | 43 | 3,163 | 1,254 | 1,076 | 178 | — | — | 85.81% | — |
| Genus specialist | Species classes | Mean F1 | Median F1 | SD F1 | Minimum F1 | Maximum F1 | % F1 ≥ 0.95 | % F1 < 0.80 | Weakest species |
|---|---|---|---|---|---|---|---|---|---|
| Ameritella | 2 | 1.000 | 1.000 | 0.000 | 1.000 | 1.000 | 100.0% | 0.0% | A. agilis / A. modesta |
| Arcopagia | 2 | 1.000 | 1.000 | 0.000 | 1.000 | 1.000 | 100.0% | 0.0% | A. crassa / A. fausta |
| Pharaonella | 2 | 1.000 | 1.000 | 0.000 | 1.000 | 1.000 | 100.0% | 0.0% | P. astula / P. aurea |
| Scutarcopagia | 2 | 0.973 | 0.973 | 0.001 | 0.971 | 0.974 | 100.0% | 0.0% | S. scobinata |
| Ardeamya | 2 | 0.955 | 0.955 | 0.022 | 0.933 | 0.977 | 50.0% | 0.0% | A. tokunagai |
| Macomopsis | 2 | 0.942 | 0.942 | 0.008 | 0.933 | 0.950 | 50.0% | 0.0% | M. melo |
| Moerella | 4 | 0.939 | 0.928 | 0.037 | 0.900 | 1.000 | 25.0% | 0.0% | M. pulchella |
| Tellinides | 3 | 0.922 | 0.909 | 0.059 | 0.857 | 1.000 | 33.3% | 0.0% | T. striatus |
| Serratina | 2 | 0.914 | 0.914 | 0.057 | 0.857 | 0.971 | 50.0% | 0.0% | S. capsoides |
| Macomona | 2 | 0.900 | 0.900 | 0.003 | 0.897 | 0.903 | 0.0% | 0.0% | M. deltoidalis |
| Tellinella | 5 | 0.822 | 0.776 | 0.073 | 0.741 | 0.923 | 0.0% | 60.0% | T. tithonia |
| Eurytellina | 5 | 0.800 | 0.769 | 0.139 | 0.588 | 1.000 | 20.0% | 60.0% | E. alternata |
| Strigilla | 4 | 0.715 | 0.769 | 0.158 | 0.467 | 0.857 | 0.0% | 50.0% | S. carnaria |
| Macoma | 4 | 0.569 | 0.533 | 0.216 | 0.333 | 0.875 | 0.0% | 75.0% | M. calcarea |
| Gastrana | 2 | 0.404 | 0.404 | 0.404 | 0.000 | 0.809 | 0.0% | 50.0% | G. fragilis |
| Genus | Species class | Test images | Correct | Incorrect | Accuracy |
|---|---|---|---|---|---|
| Gastrana | fragilis | 9 | 0 | 9 | 0.00% |
| Macoma | calcarea | 12 | 4 | 8 | 33.33% |
| Macoma | incongrua | 15 | 6 | 9 | 40.00% |
| Strigilla | carnaria | 30 | 14 | 16 | 46.67% |
| Eurytellina | alternata | 17 | 10 | 7 | 58.82% |
| Macoma | nasuta | 21 | 14 | 7 | 66.67% |
| Strigilla | chroma | 29 | 20 | 9 | 68.97% |
| Tellinella | tithonia | 27 | 20 | 7 | 74.07% |
| Eurytellina | angulosa | 24 | 18 | 6 | 75.00% |
| Eurytellina | punicea | 65 | 50 | 15 | 76.92% |
| Tellinella | philippii | 31 | 24 | 7 | 77.42% |
| Tellinella | cruciata | 67 | 52 | 15 | 77.61% |