Epitoniidae: Scientific Background, Hierarchical CNN Modelling, and Performance of One Family-Level and Six Genus-Level Models
Published on: May, 2026
Abstract
The family Epitoniidae is a morphologically distinctive but taxonomically complex lineage of marine gastropods, characterized by high-spired shells, strong axial sculpture, and frequent ecological association with cnidarian hosts. These properties make the family an informative test case for shell-image classification within a hierarchical convolutional neural network framework. In this study, one family-level model and six genus-level models were developed for Epitoniidae within the IdentifyShell.org pipeline. The family-level model was trained to discriminate six focal genera—Amaea, Cirsotrema, Epitonium, Gyroscala, Janthina, and Opalia—and achieved high overall performance, with validation accuracy 0.975, weighted F1-score 0.970, and macro F1-score 0.965. Genus-level species classifiers also performed strongly overall, but with substantial variation among genera. The strongest result was obtained for Cirsotrema (validation accuracy 0.970; weighted F1 0.987), whereas the most demanding task was Epitonium, which combined the largest dataset and highest number of species classes with the lowest aggregate performance (validation accuracy 0.864; weighted F1 0.865). Cross-genus analysis showed that classification difficulty was more strongly associated with the number of output classes than with raw dataset size alone, while within-genus dispersion analysis demonstrated that lower performance could arise either from localized problematic species or from broad class-level heterogeneity. These results indicate that shell-based CNN classification within Epitoniidae is highly feasible at both family and genus level, but that performance declines in morphologically broader and taxonomically less cohesive groups. The study therefore provides both a technical benchmark for hierarchical molluscan classification and a morphology-based indication of how consistently current taxonomic labels can be recovered from standardized shell imagery.
Introduction
The family Epitoniidae represents a morphologically distinctive and ecologically specialized lineage within marine Gastropoda. Traditionally known as the wentletraps, epitoniids are most readily recognized by their often high-spired shells, strong axial costae or lamellae, circular to ovate apertures, and horny paucispiral operculum [1]. In the benthic members of the family, this shell architecture gives rise to the characteristic staircase-like appearance from which the common name is derived. Yet the biological significance of Epitoniidae extends well beyond shell form alone. The family is one of the best-known gastropod lineages associated with cnidarian hosts, and many species are predators or ectoparasites of sea anemones, scleractinian corals, and related groups. As a result, Epitoniidae has long been important not only to shell collectors and taxonomists, but also to broader studies of trophic specialization, host association, and morphological evolution in marine molluscs [2, 3, 4, 5]
From a systematic perspective, Epitoniidae is both species-rich and taxonomically difficult. Modern broad classifications place the family in the superfamily Epitonioidea, but higher placement above that level has remained unstable enough that major biodiversity systems have at times continued to display it under Caenogastropoda incertae sedis. In addition, the scope of the family has broadened in recent classification systems: former family-level groups such as Janthinidae, Recluziidae, and Nystiellidae are now generally treated within Epitoniidae sensu lato. This broad usage is phylogenetically informative, but it also makes the family more heterogeneous than the narrower benthic “wentletrap” concept that dominates much of the classical ecological and conchological literature [2, 4, 6, 7].
The internal taxonomy of the family is likewise unsettled. Catalogues, browser totals, and database summaries do not yield a single stable denominator for the diversity of Epitoniidae, because they mix accepted living species, extinct taxa, subordinate names, and historical synonymy in different ways. What is clear, however, is that the family is large and revision-prone, and that some of its largest traditional shell-based genera, especially Epitonium, do not correspond cleanly to monophyletic lineages. Molecular work on coral-associated epitoniids has shown that the traditional concept of Epitonium is polyphyletic, while at the same time supporting the distinctiveness of several host-associated clades. These findings reinforce a broader conclusion already evident from morphological and ecological studies: shell characters are diagnostically valuable in Epitoniidae, but shell-based classification alone does not adequately capture evolutionary history across the family [3, 5, 8].
This combination of broad recognizability and internal instability is directly relevant for image-based classification. On the one hand, many epitoniids possess a clear family-level shell signal: elongated turreted form, deep sutures, conspicuous axial ribs, and a generally distinctive wentletrap habitus make them visually separable from many other marine gastropods. On the other hand, the family also contains marked heterogeneity in shell proportions, sculpture, ecology, host association, and evolutionary history. In several lineages, especially those associated with corals, species delimitation has required not only shell morphology but also radular characters, jaws, operculum, egg-capsule morphology, host specificity, and DNA data. This makes Epitoniidae especially relevant as a test case for evaluating how far shell imagery alone can support taxonomic discrimination at different levels of a hierarchical identification system [1, 3, 5, 8, 9].
The family is therefore well suited to the hierarchical modelling framework developed for IdentifyShell.org, in which classification proceeds stepwise across taxonomic ranks rather than through a single flat model. Within such a framework, Epitoniidae presents an informative intermediate challenge. Its overall shell architecture suggests that recognition at family level should be feasible, but its internal taxonomic breadth and uneven morphological cohesion imply that finer discrimination at genus and species level may be substantially more difficult. In that sense, Epitoniidae provides an opportunity to examine not only model performance, but also the biological limits of shell-based diagnosability across a family in which taxonomy, ecology, and morphological convergence are known to interact in complex ways [5, 8].
The present report documents that effort through the development of one family-level model and six genus-level models for Epitoniidae. The goal is twofold: first, to evaluate the practical performance of hierarchical CNN classification in a biologically non-trivial molluscan family; and second, to use those results as an indirect morphology-based benchmark of how consistently current taxonomic labels can be recovered from standardized shell images. In that respect, the study is intended not as a taxonomic revision, but as a family-focused technical and scientific contribution to the broader IdentifyShell project.
Methods
Data Acquisition
Shell images were collected from many online resources, from specialized websites on shell collecting to institutes and universities. One of the largest collections of shell images is available on GBIF. Also online marketplace such as ebay contain a large collection of images. Other large shell image collections are available at , Malacopics, Femorale and Thelsica. A shell dataset created for AI is available [7].
The Epitoniidae Dataset
Table S1 lists all available images by genus. Species names and taxonomic assignments follow the
nomenclature
and classification
provided by WoRMS and MolluscaBase to ensure consistency and standardization.
Only genera with at least 100 images were included in the dataset, and for the genus models, at least 25
images were used for a species to be included.
Only 6 genera were retained (Table S1).
Hardware and Software
Experiments were performed on a HP Omen 30L GT13 workstation equipped with an Intel(R) Core(TM) i9-10850K CPU @ 3.60GHz, 64 GB of RAM, and an NVIDIA GeForce RTX 3080 GPU with 10 GB of VRAM. All code was written in Python 3.10.12, leveraging TensorFlow/Keras for neural network operations, scikit-learn for classification and evaluation, and OpenCV for image manipulation.
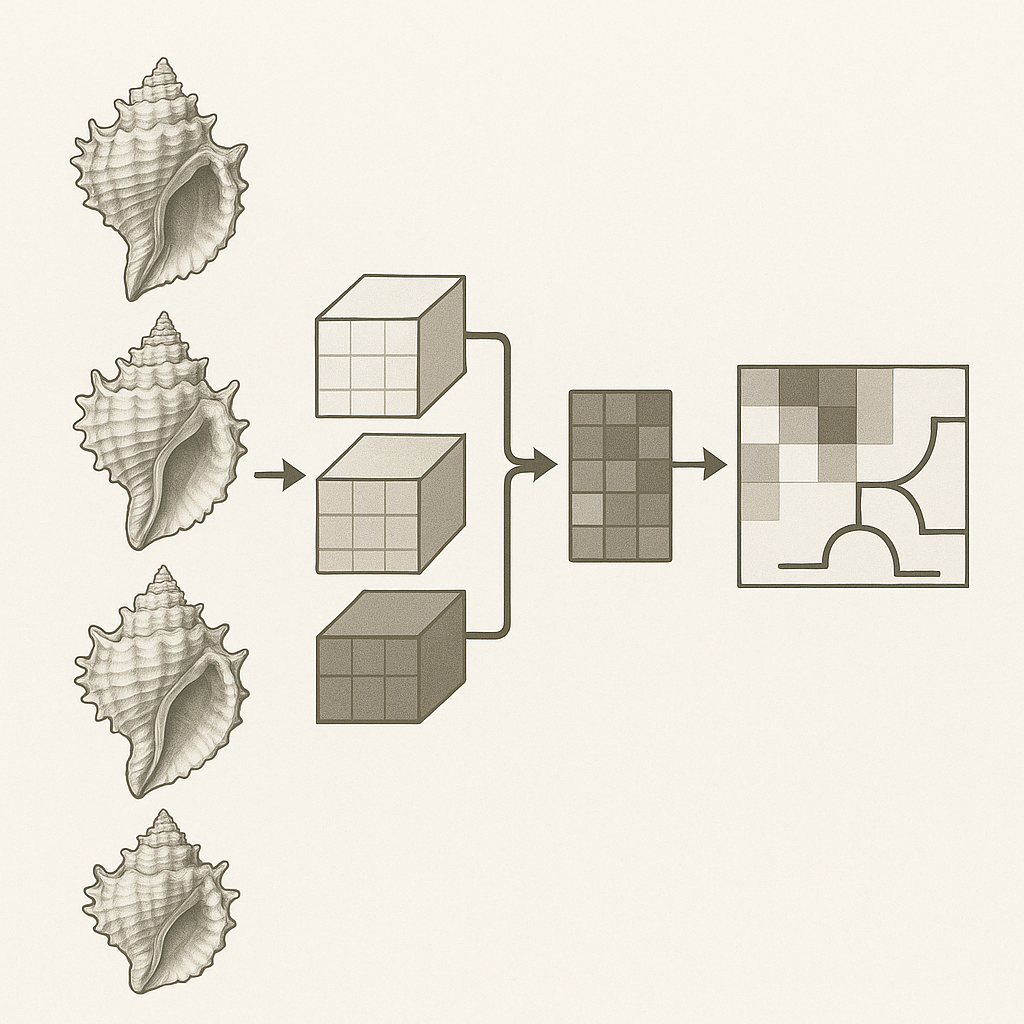
CNN Architecture
The core of our image classification pipeline utilized the EfficientNetV2 B2 architecture. This model was
chosen based on its strong performance in previous
experiments with molluscan datasets; see also previous experiments [8], which
demonstrated its efficacy in capturing relevant features
for shell identification.
We employed a transfer learning approach, leveraging weights pre-trained on the ImageNet dataset to
initialize the EfficientNetV2 B2 model. During the fine-tuning
phase for our specific molluscan classification tasks, the majority of the base model's layers were kept
frozen to retain the generalized features learned from
ImageNet. Specifically, for some model training, top layers of the EfficientNetV2 B2 architecture were
unfrozen and allowed to update during training.
The standard EfficientNetV2 B2 architecture was used for its convolutional blocks, filter configurations,
and pooling strategies, as described in the original
literature for this model family. Our primary modifications were made to the classifier head. The original
top layers were replaced with a new sequence of layers
to adapt the model for our specific number of output classes (i.e., taxonomic groups). This custom head
consisted of a GlobalAveragePooling2D layer applied to
the output of the base model, followed by a BatchNormalization layer to stabilize activations, and a Dropout
layer
to mitigate overfitting. The final layer was a dense layer with a softmax activation function to produce
probabilities for each class.
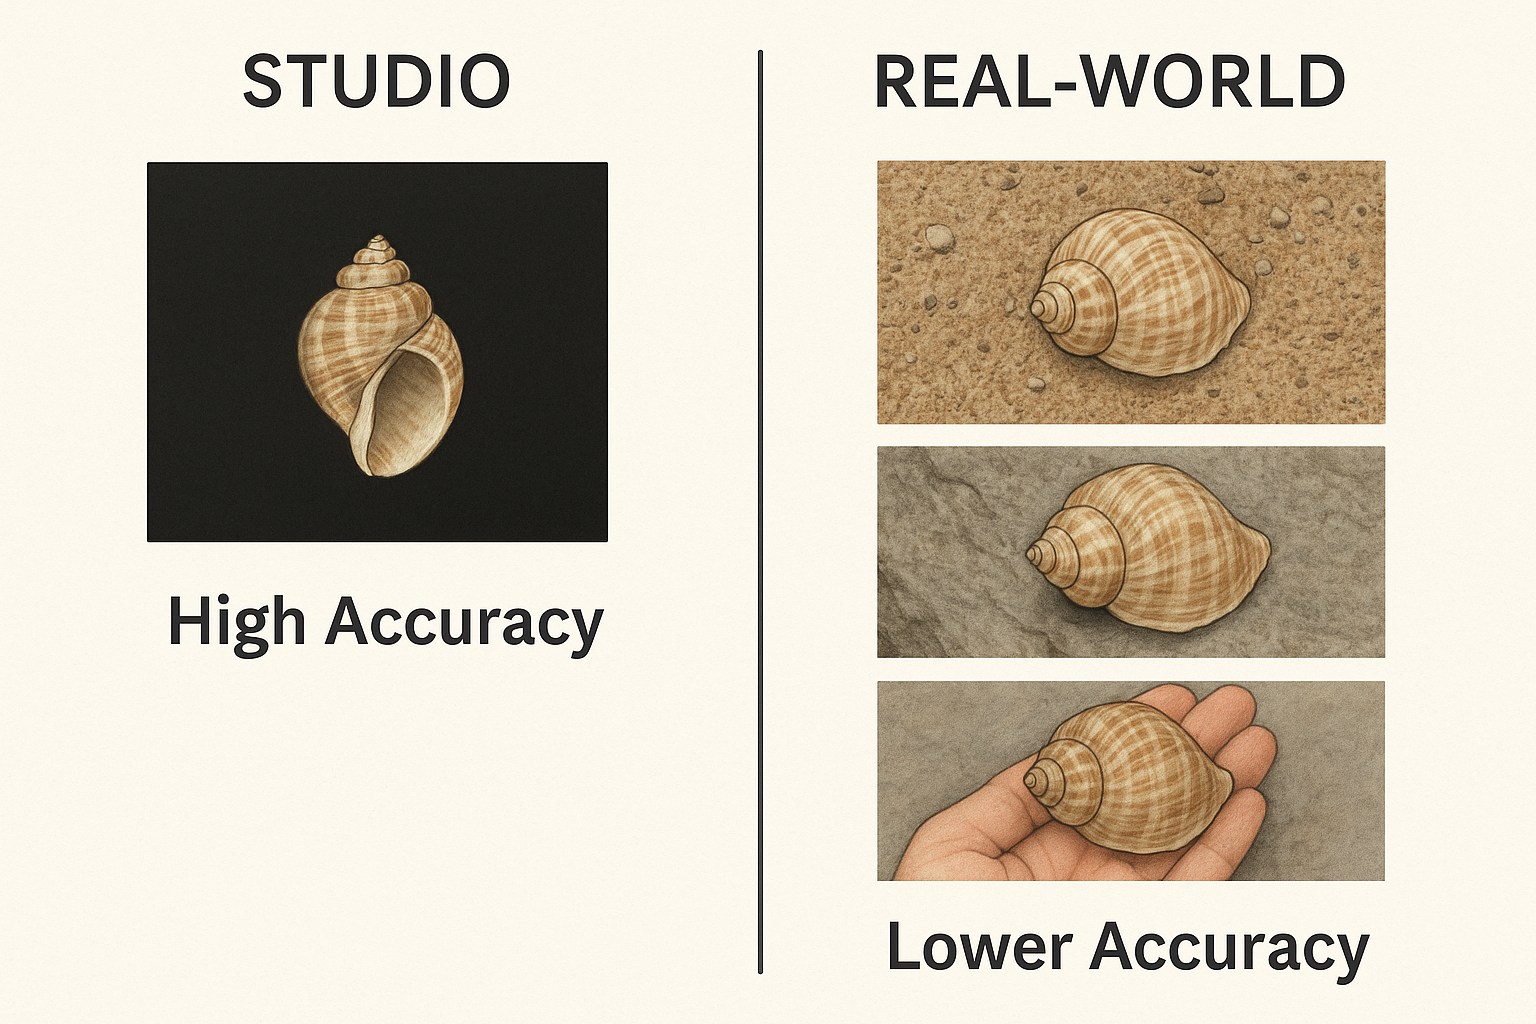
Image Pre-processing
All names were checked against WoRMS or MolluscaBase for their validity. Names that were not found in WoRMS/MolluscaBase were excluded for further processing. While a large part of this data quality step was automated, a manual verification (time-consuming) step was also included. In addition to text-based quality control, both automated and manual preprocessing steps were applied to the images. Shells were detected in all images and cut out of the original image, having only 1 shell on each image. Other objects on the raw images (labels, measures, hands holding a shell, etc.) were removed. When appropiate the background was changed to a uniform black background. A square image was made by padding the black background. All shells were resized (400 x 400 px).
Training Regimen
All models were trained using the Adam optimization algorithm. A default learning rate of 0.0005 was
initially set; any deviations from this for specific
experiments are noted in their respective results sections. To dynamically adjust the learning rate during
training, a "reduce on plateau" schedule was
implemented. This schedule monitored the validation loss and reduced the learning rate by a factor (0.1) if
the validation loss did not improve for a
pre-defined number of epochs (5).
For the loss function, we employed focal loss with a gamma (γ) value of 2.0. This choice was made to address
potential class imbalances by down-weighting
the loss assigned to well-classified examples, thereby focusing training on harder-to-classify instances.
Training was conducted with a batch size of 64 images. Models were set to train for a maximum of 100 epochs.
However, an early stopping criterion was also
utilized, which halted training if the validation loss did not show improvement for a specified number of
consecutive epochs (patience=5). This helped
to prevent overfitting and select the model checkpoint with the best generalization performance on the
validation set.
To further mitigate overfitting, L2 regularization was applied to the kernel weights of the convolutional
and dense layers. A regularization factor of 0.0001
was used for this purpose.
Evaluation Metrics
The evaluation of the performance of the CNN models was carried out by using standard metrics for
classification: accuracy, precision, recall, and F1 score,
which are defined in terms of the number of FP (false positives); TP (true positives); TN (true negatives);
and FN (false negatives) as follows:
Results
Family-level genus classification within Epitoniidae
For the family-level Epitoniidae training, the classification task was defined at the genus level, with the six retained genera used as output classes: Amaea, Cirsotrema, Epitonium, Gyroscala, Janthina, and Opalia. The dataset comprised 8,784 images distributed across these six classes, with a marked imbalance in class size. Epitonium was by far the largest class with 4,915 images, followed by Cirsotrema (1,183), Gyroscala (793), Amaea (719), Opalia (636), and Janthina (538).
Among the four reviewed runs, run v1a03 achieved the best overall performance and was retained as the main reference result for this model. This run used an EfficientNetV2B2 backbone with batch size 64, learning rate 0.0005, focal loss, top dropout 0.2, L2 regularization 0.0001, 400 px input images, and 80% training split. In this reviewed run, the model reached a training accuracy of 0.976, validation accuracy of 0.975, weighted F1-score of 0.970, and macro F1-score of 0.965. The closeness of training and validation accuracy suggests that the model converged well and did not show strong evidence of severe overfitting in this training.
Performance was high for most genera, but not uniform. The best class-level results were obtained for Janthina, with accuracy 0.988, precision 0.988, recall 0.988, and F1 0.988. Cirsotrema also performed strongly, with accuracy 0.983 and F1 0.983, followed by Amaea with F1 0.978 and a recall of 1.000. Epitonium, despite being the most heterogeneous and by far the largest class, still achieved accuracy 0.975 and F1 0.975. Opalia also remained strong, with accuracy 0.967 and F1 0.967.
The weakest class was Gyroscala, for which the model achieved accuracy 0.900, precision 0.905, recall 0.896, and F1 0.900. Although this is still a good result in absolute terms, it is clearly lower than for the other five genera and therefore represents the principal source of residual error in the family-level model.
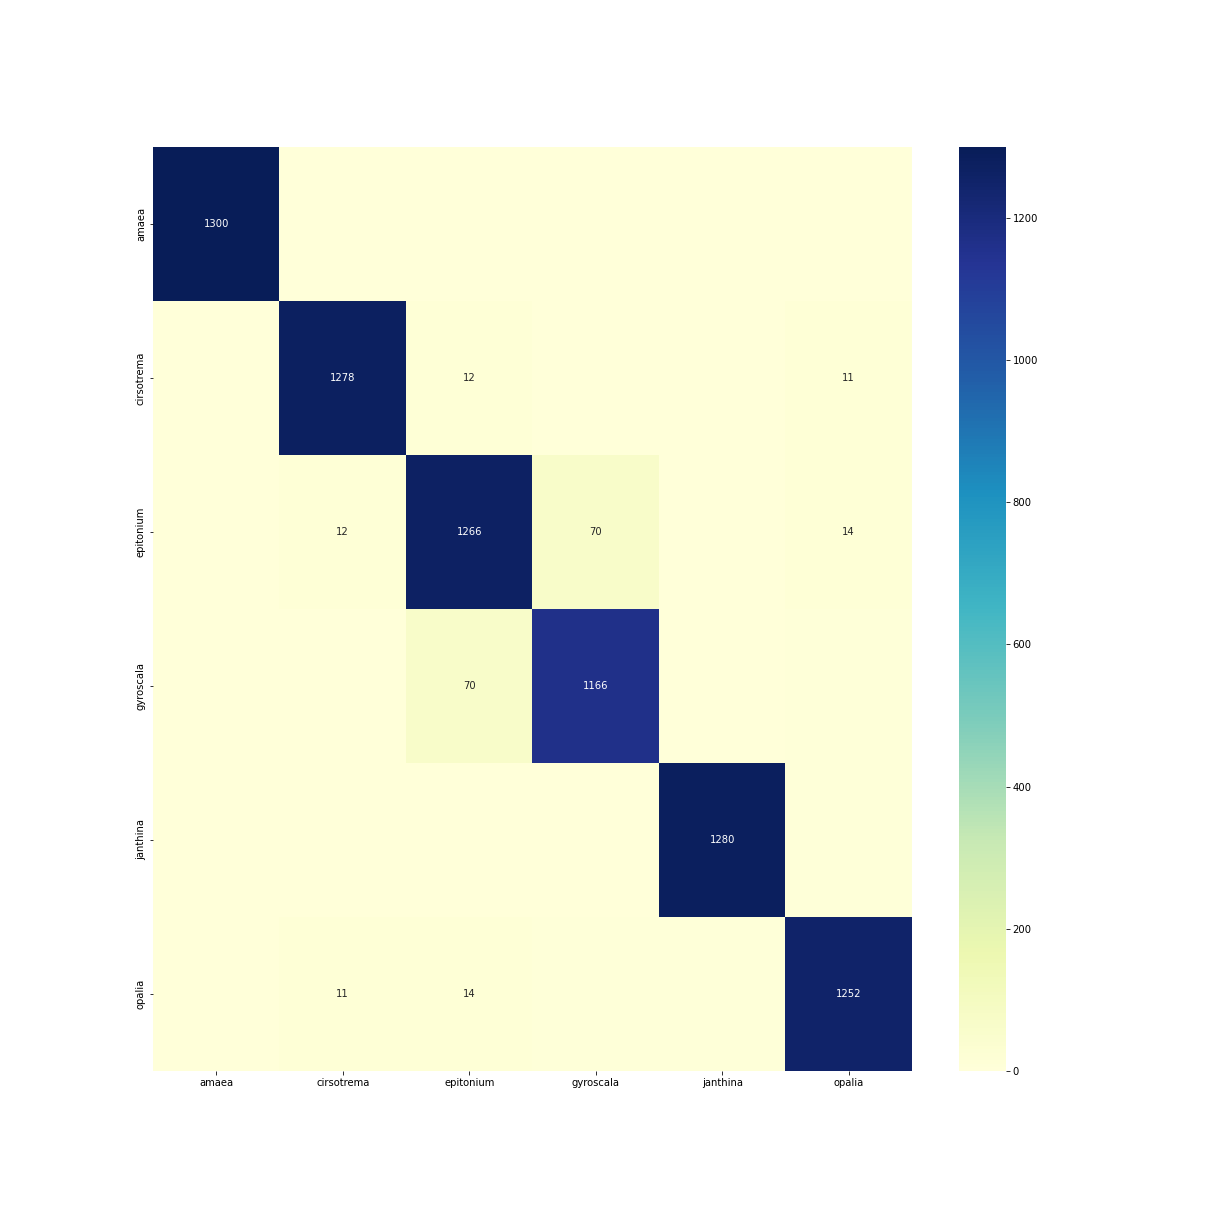
Confusion heatmap of the best-performing Epitoniidae family model (run v1a03), in which the six retained genera (Amaea, Cirsotrema, Epitonium, Gyroscala, Janthina, and Opalia) were used as output classes. Most predictions are concentrated along the diagonal, indicating strong overall discrimination among genera. The largest residual confusion occurs between Gyroscala and Epitonium, with smaller overlaps involving Cirsotrema and Opalia. In contrast, Janthina and Amaea appear more clearly separated from the other classes. This pattern is consistent with the overall quantitative results, where Gyroscala was the weakest-performing class, whereas Janthina and Amaea showed the highest class-level performance.
As shown in Figure 1, most predictions lie on the diagonal, confirming the strong overall separability of the six genera. However, the errors are not randomly distributed. The strongest off-diagonal concentration appears between Epitonium and Gyroscala, with a visible confusion band linking these two genera. Smaller confusion signals are also present between Epitonium and Cirsotrema, and between Cirsotrema and Opalia, whereas Amaea and especially Janthina appear more clearly isolated.
Taken together, these results indicate that genus-level discrimination within Epitoniidae is highly feasible within the current IdentifyShell framework. This is a relevant finding because Epitoniidae is not a trivial family from either a taxonomic or a visual perspective. The family combines a recognizable overall identity with substantial internal diversity, and the present experiment shows that a CNN can exploit that structure effectively. In particular, the strong results for Amaea, Cirsotrema, Janthina, and Opalia, together with the robust performance for the much larger Epitonium class, suggest that the family-level genus model is already operationally useful as a routing or intermediate hierarchical classifier.
At the same time, the model is not yet uniformly strong across all genera. Gyroscala remains the clearest weak point, and the balanced test results further suggest that the distinction between Gyroscala and morphologically related genera, especially Epitonium, deserves closer investigation.
Genus-level species classification models
Six separate genus-level classifiers were trained to resolve species within the focal Epitoniidae genera. The aggregate performance of the six genus-level classifiers is summarized in Table I. Performance was consistently high, although clear differences emerged among genera in relation to taxonomic breadth, number of classes, and apparent morphological complexity. The strongest result was obtained for Cirsotrema, where the model distinguished 8 species from 1,153 images with a validation accuracy of 0.970, weighted F1 of 0.987. Per-class performance was uniformly excellent, with all species reaching F1 values of 0.957 or higher, indicating that species boundaries in this genus were captured very cleanly by the classifier.
Very strong results were also obtained for the smaller 4-class genera Gyroscala and Janthina. The best Gyroscala model, trained on 793 images, reached a validation accuracy of 0.968 and weighted F1 of 0.971, with perfect per-class scores for rupicola and statuminata, and only modestly lower scores for commutata and coronata. The Janthina model, trained on 538 images, achieved a validation accuracy of 0.953 and weighted F1 of 0.960; all four species were classified with high precision, with Janthina janthina itself showing particularly strong performance (F1 = 0.978).
The Amaea and Opalia models also performed well overall, though with more uneven class-wise behavior. In Amaea, the best reviewed run used 719 images across 9 species and achieved a validation accuracy of 0.951 with weighted F1 of 0.932. Several classes, including ferminiana and magnifica, were classified perfectly, whereas gazeoides remained clearly problematic, with an F1 score of only 0.444, indicating a localized source of confusion rather than a general model failure. In Opalia, the best run used 636 images across 8 species and reached a validation accuracy of 0.945 with weighted F1 of 0.949. Most species showed strong discrimination, but lower F1 values for bicarinata (0.818) and pumilio (0.857) suggest that these taxa were harder to separate than the rest of the genus.
The most demanding genus-level task was Epitonium. This model covered by far the largest and most taxonomically complex dataset, with 4,269 images distributed over 42 species, and reached a best reviewed validation accuracy of 0.864, weighted F1 of 0.865. Despite this lower aggregate performance, many classes still showed strong results, including angulicinctum, celesti, lyra, oppositum, and thrasys, all with F1 = 1.000, and scalare with F1 = 0.974. However, several other species were substantially more difficult, most notably syoichiroi (F1 = 0.421), with additional weaker classes such as alatum, clathratulum, jukesianum, profundum, occidentale, and tokyoense. This broad spread in per-class performance is consistent with the much greater species richness and within-genus heterogeneity represented in Epitonium relative to the other genera.
Table I: Performance metrics of the six genus-level Epitoniidae classifiers.
| Genus | Images | Classes | Train accuracy | Validation accuracy | Weighted recall | Weighted F1 | Macro precision |
|---|---|---|---|---|---|---|---|
| Amaea | 719 | 9 | 0.950 | 0.951 | 0.931 | 0.932 | 0.894 |
| Cirsotrema | 1,153 | 8 | 0.983 | 0.970 | 0.988 | 0.987 | 0.982 |
| Epitonium | 4,269 | 42 | 0.900 | 0.864 | 0.866 | 0.865 | 0.827 |
| Gyroscala | 793 | 4 | 0.978 | 0.968 | 0.970 | 0.971 | 0.976 |
| Janthina | 538 | 4 | 0.995 | 0.953 | 0.957 | 0.960 | 0.976 |
| Opalia | 636 | 8 | 0.974 | 0.945 | 0.951 | 0.949 | 0.938 |
Taken together, these six genus-level models show that species-level classification within Epitoniidae is highly feasible, but not equally difficult across genera. The best-performing genera were those with relatively limited class sets and clear interspecific separation, whereas performance decreased in the largest and most heterogeneous genus. This pattern is biologically plausible, as the family-level literature already indicates that Epitoniidae combines both well-delimited lineages and groups affected by morphological convergence, taxonomic instability, or strong shell similarity. The genus-level results therefore complement the family-level classifier by showing that broad generic separation is followed, in most genera, by strong species-level resolution, while also identifying Epitonium as the principal fine-grained challenge in the present modelling series.
Cross-Genus Variation in Species-Level Classification Difficulty
To examine why the six genus-level classifiers differed in performance, an exploratory cross-genus analysis was carried out using simple descriptors of task complexity and dataset structure. The aim was to assess whether classification difficulty was more closely associated with raw dataset size or with the granularity of the underlying taxonomic task. Across the six genera, the clearest pattern was a negative association between performance and the number of output classes. Genera with more species classes tended to show lower validation accuracy, lower weighted F1, and lower macro precision, indicating that species-level discrimination became more difficult as the classification problem became finer grained.
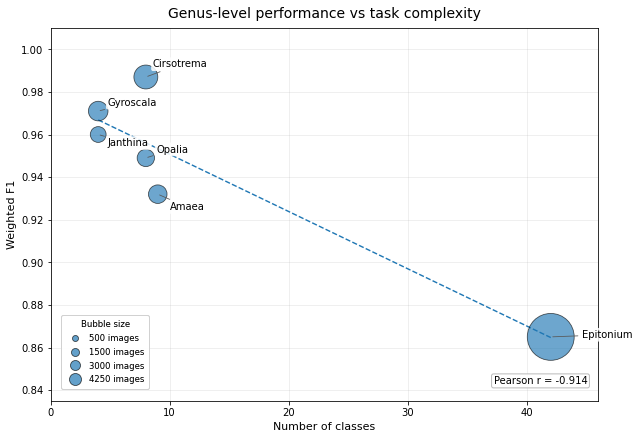
This trend is illustrated in Figure 2, where weighted F1 is plotted against the number of species classes for each genus-level model, with bubble size representing the total number of images available per genus. The figure shows that the best-performing models were concentrated among genera with relatively few output classes, whereas performance declined as task granularity increased.
Additional class-balance descriptors showed that imbalance varied substantially among genera, but did not map cleanly onto performance. In particular, Cirsotrema and Epitonium both displayed strong class-size skew, yet Cirsotrema achieved the strongest aggregate result whereas Epitonium remained the weakest genus-level model. This supports the interpretation that cross-genus performance differences were driven more by taxonomic breadth and within-genus heterogeneity than by imbalance alone. The negative relationship between task complexity and performance is visualized in Figure 2.
In particular, Epitonium occupies a clearly distinct position, combining the largest number of species classes with the weakest aggregate performance. This makes Epitonium the principal outlier in the present model series and the strongest contributor to the overall negative trend between task complexity and classification success.
The derived genus-level descriptors are summarized in Table II. These values show that the cross-genus pattern cannot be explained simply by total image count. Epitonium had by far the largest dataset, yet remained the most difficult genus-level task, whereas smaller but taxonomically simpler genera such as Gyroscala, Janthina, and Cirsotrema achieved substantially stronger results. This indicates that increasing dataset size alone did not compensate for the increase in morphological heterogeneity and class complexity associated with the larger genus-level tasks.
Table II. Cross-genus task-complexity, class-balance, and performance descriptors for the six genus-level Epitoniidae models.
| Genus | Images | Classes | Images / class | Min / class | Median / class | Max / class | Imbalance ratio (max/min) |
CV of class size | Validation accuracy | Weighted F1 | Macro precision | Generalization gap (train acc − val acc) |
|---|---|---|---|---|---|---|---|---|---|---|---|---|
| Amaea | 719 | 9 | 79.9 | 34 | 53.0 | 166 | 4.88 | 0.565 | 0.951 | 0.932 | 0.894 | -0.001 |
| Cirsotrema | 1,153 | 8 | 144.1 | 40 | 109.0 | 482 | 12.05 | 0.933 | 0.970 | 0.987 | 0.982 | 0.013 |
| Epitonium | 4,269 | 42 | 101.6 | 25 | 59.0 | 551 | 22.04 | 0.961 | 0.864 | 0.865 | 0.827 | 0.036 |
| Gyroscala | 793 | 4 | 198.3 | 85 | 131.5 | 445 | 5.24 | 0.732 | 0.968 | 0.971 | 0.976 | 0.010 |
| Janthina | 538 | 4 | 134.5 | 58 | 83.0 | 314 | 5.41 | 0.776 | 0.953 | 0.960 | 0.976 | 0.042 |
| Opalia | 636 | 8 | 79.5 | 37 | 74.0 | 133 | 3.59 | 0.463 | 0.945 | 0.949 | 0.938 | 0.029 |
A secondary trend was observed for images per class. Genera with more images available per species tended to show somewhat better performance, although this positive relationship was weaker than the negative effect associated with number of classes. By contrast, class imbalance did not emerge as a dominant explanatory factor in this six-genus comparison. This is particularly evident in Cirsotrema, which showed strong imbalance in class sizes but nevertheless achieved the highest overall genus-level performance. The data therefore suggest that, within the present modelling series, the principal driver of cross-genus variation was not imbalance alone, but the combination of taxonomic breadth and within-genus heterogeneity.
Because only six genera were available for comparison, the statistical analysis should be interpreted as exploratory rather than inferential. Pearson correlations were used to summarize linear trends, whereas Spearman correlations were included to assess rank-based robustness and reduce sensitivity to the influence of the Epitonium outlier. Within this framework, the strongest negative association was observed between number of classes and weighted F1, while images per class showed only a weaker positive tendency. The detailed correlation coefficients are provided separately in the Supplementary Table S8.
Taken together, these results refine the interpretation of the genus-level modelling series. Species-level classification within Epitoniidae is clearly feasible, but performance does not scale simply with the number of available images. Instead, the results indicate that model difficulty is driven primarily by the complexity of the taxonomic decision space. Genera with relatively few, visually well-delimited species can be resolved with very high accuracy, whereas larger and more internally heterogeneous genera remain substantially more challenging even when more training images are available. In that sense, the cross-genus comparison reinforces the broader conclusion of this study: the main bottleneck in Epitoniidae classification lies not at the level of family recognition, but in the finer-grained discrimination required within morphologically diverse genera.
Generalization gaps were generally modest across the six genus-level models, but they were not uniform. The smallest differences between training and validation accuracy were observed for Amaea, Gyroscala, and Cirsotrema, whereas Janthina and Epitonium showed the largest gaps. This suggests that Epitonium was not only the most taxonomically complex genus-level task, but also one of the less tightly generalizing models, although overall cross-genus differences remained more strongly associated with task complexity than with generalization gap alone.
Within-Genus Dispersion of Species-Level Classification Performance
Within-genus dispersion analysis showed that the genus-level models differed not only in aggregate performance but also in the uniformity of species-level discrimination. Cirsotrema combined a very high mean per-class F1 with extremely low dispersion, indicating that performance was both strong and stable across species. Amaea showed a more localized weakness, with a relatively high median per-class F1 but a much lower minimum F1 driven by one poorly resolved class. By contrast, Epitonium displayed both the lowest minimum per-class F1 and the highest proportion of weak classes (F1 < 0.80), confirming that its lower aggregate performance reflected broad within-genus heterogeneity rather than a single isolated failure. These within-genus dispersion descriptors are summarized in Table III.
Table III. Within-genus dispersion of per-class F1 scores for the six genus-level Epitoniidae models
| Genus | Classes | Mean per-class F1 | Median per-class F1 | SD of per-class F1 | Minimum per-class F1 | % classes with F1 ≥ 0.95 | % classes with F1 < 0.80 |
|---|---|---|---|---|---|---|---|
| Amaea | 9 | 0.896 | 0.963 | 0.173 | 0.444 | 55.6 | 11.1 |
| Cirsotrema | 8 | 0.984 | 0.985 | 0.015 | 0.957 | 100.0 | 0.0 |
| Epitonium | 42 | 0.837 | 0.829 | 0.140 | 0.421 | 16.7 | 31.0 |
| Gyroscala | 4 | 0.977 | 0.986 | 0.026 | 0.938 | 75.0 | 0.0 |
| Janthina | 4 | 0.947 | 0.945 | 0.023 | 0.919 | 50.0 | 0.0 |
| Opalia | 8 | 0.932 | 0.951 | 0.062 | 0.818 | 50.0 | 0.0 |
These within-genus dispersion patterns confirm that lower aggregate genus-level performance can arise either from isolated problematic species, as in Amaea, or from broad class-level heterogeneity, as in Epitonium.
Discussion
The present results show that Epitoniidae is morphologically coherent at the family level, but markedly heterogeneous at finer taxonomic scales. This contrast is evident in the strong family-level confusion structure shown in Figure 1 and in the genus-level summary metrics presented in Table I. The family-level classifier separated the six focal genera with very high performance, indicating that Epitoniidae retains a strong shell-based family signal in image space. This is apparent both in the cross-genus comparison in Table I and in the task-complexity descriptors summarized in Table II. The literature is consistent with this broad recognizability, because epitoniids are generally described as morphologically diagnosable by a characteristic combination of shell architecture and anatomical traits, even though their higher systematics and internal generic limits remain unstable [9, 10, 4].
At the same time, the genus-level results show that family-level coherence does not translate uniformly into easy species-level discrimination. This agrees with the literature review, which emphasizes that shell characters in Epitoniidae are useful, but do not map cleanly onto monophyletic shell-based genera, and that shell-only generic classification has often overstated relationships [5, 10]
This combination of strong family-level recognizability and uneven genus-level recovery is biologically informative. It suggests that Epitoniidae possesses a recognizable overall shell gestalt, but that this coherence breaks down unevenly within genera. In other words, some epitoniid lineages appear morphologically compact and well partitioned at species level, whereas others occupy broader or more overlapping shell morphospaces. This interpretation fits the current systematic view of the family as both distinctive and taxonomically unstable, especially in its large traditional shell-based genera [5, 10].
Among the six focal genera, Epitonium is clearly the principal challenge genus. It was the largest genus-level task in the study, but also the weakest aggregate model, and its per-class performance was highly uneven. This is not merely a technical weakness of the classifier. It is consistent with the existing literature, which identifies Epitonium as one of the largest traditional shell-based genera, notes that it is non-monophyletic in molecular work, and explicitly indicates that the Epitonium complex requires integrated revision using shell, anatomy, radula, operculum, spawn, and DNA [5, 10].
The weak and heterogeneous recovery of Epitonium therefore appears biologically meaningful: it supports the view that Epitonium is not a morphologically compact and uniformly delimited lineage, but rather a broad and taxonomically difficult assemblage [5, 10].
The other genera occupy intermediate positions and reinforce this broader pattern. Gyroscala, Janthina, and Opalia all performed strongly overall, but with more moderate internal dispersion than Cirsotrema. Amaea also performed well overall, but included one extreme outlier, A. gazeoides. Together, these genera show that shell-based diagnosability in Epitoniidae is not binary, but varies along a gradient from highly cohesive genera to genera or species groups in which shell form is less exclusively informative [10]
The Amaea result is especially relevant because it shows that biologically meaningful difficulty can be highly localized. The genus model performed well overall, yet Amaea gazeoides was much weaker than all other classes. Such focal underperformance may point to taxa in which shell differences are subtle, source material is inconsistent, or current names encompass broader morphological variation than expected. This interpretation is consistent with the literature emphasis that shell shape alone is often insufficient for species recognition in at least some epitoniid groups and that additional characters such as radula, jaws, operculum, egg-capsules, ecology, and DNA can be especially informative [9, 10, 11]
More broadly, the present results support the view that CNN performance can be used as indirect evidence about shell-based diagnosability in Epitoniidae. When a genus model is both strong and uniform, shell morphology alone appears highly informative for species recognition in the image domain used here. When a genus is weak or highly dispersed, shell form may be less exclusive on its own, at least under current taxonomic circumscription and with standard shell images. This does not mean that CNNs are testing taxonomy directly. Rather, they provide a morphology-based benchmark of how consistently current labels can be recovered from shell images. That framing is justified by the literature, which repeatedly notes both the diagnostic value and the limitations of shell-only classification in Epitoniidae [9, 10, 5]
The uneven results across genera can also be related, cautiously, to the family’s ecological and evolutionary context. Epitoniidae is a cnidarian-associated lineage whose best-studied members are predators or ectoparasites on sea anemones and corals [12, 9, 5]. Coral-associated clades often show strong host specificity and habitat partitioning, whereas some actiniarian-associated assemblages appear more generalist, although that apparent generalism may partly reflect unresolved cryptic diversity [13, 14, 15] This provides a plausible biological framework for the model differences observed here: in some lineages, ecological specialization may sharpen species-level shell differentiation, whereas in others repeated shell solutions or broader ecological overlap may blur boundaries. That interpretation should remain cautious, because the present study does not directly test host association or phylogeny [5, 14]
The case of Janthina deserves a brief comment in this context. Modern broad classifications include pelagic Janthina and Recluzia within Epitoniidae sensu lato, even though they are ecologically and morphologically atypical of the benthic wentletrap syndrome [16, 17]. Its relatively strong recovery in the present dataset likely reflects the distinctiveness of this pelagic shell syndrome, but it also highlights how heterogeneous the family has become under broad modern circumscription [16]
A careful interpretation must also state clearly what these results do and do not say about taxonomy. Strong classifier performance does not prove taxonomic correctness, and weak performance does not automatically invalidate current species boundaries. This caution is necessary because molecular studies have confirmed some epitoniid clades, especially coral-associated lineages, but have also shown that traditional Epitonium is polyphyletic and that deeper relationships across the family remain weakly resolved [5]. Accordingly, the present results should not be interpreted as formal taxonomic tests. They are better understood as a morphology-based benchmark showing where current classification is strongly reflected in shell images and where it is less cleanly recovered [5, 10]
This makes the study relevant beyond model evaluation alone. The literature emphasizes that diagnostic value in Epitoniidae often emerges from combining shell traits with anatomy, operculum, spawn, radula, host association, and molecular evidence [9, 11, , 5]. The present results fit naturally into that framework. Strong family-level and genus-level models suggest that Epitoniidae can be routed effectively in hierarchical identification workflows and can support preliminary specimen sorting in digitized collections, whereas weaker genera such as Epitonium may require more cautious review.
Finally, the results reinforce a broader conclusion already present in the literature: shell imagery captures an important but incomplete component of epitoniid biology. Recent syntheses explicitly identify several priorities for future work, including denser molecular phylogeny, integrated revision of the Epitonium complex, host-specificity testing outside coral-associated clades, and broader ecological and larval studies [5, 15]. Cases that remain difficult in shell-image classification are therefore precisely the cases where additional evidence such as anatomy, radular and jaw characters, opercular microsculpture, host association, locality, and DNA are likely to be most informative [5, 11]
References
- [1] idscaro Epitoniidae, Berry, 1910. https://www.idscaro.net/sci/04_med/class/fam3/epitoniidae.htm (accessed April 16, 2026)
- [2] Deep Sea News. Echinoderms, Cnidarians, & The Gastropods That Parasitize Them. https://deepseanews.com/2008/03/echinoderms-cnidarians-the-gastropods-that-parasitize-them/ (accessed April 16, 2026)
- [3] Wikipdia. Wentletrap. https://en.wikipedia.org/wiki/Wentletrap (accessed April 16, 2026)
- [4] WoRMS. Epitoniidae S. S. Berry, 1910 (1812). https://www.marinespecies.org/aphia.php?p=taxdetails&id=132 (accessed April 16, 2026)
- [5] A Gittenberger and B Kokshoorn. A molecular phylogeny of Epitoniidae (Mollusca: Gastropoda), focusing on the species associated with corals. in: Gittenberger, A. The evolutionary history of parasitic gastropods and their coral hostsin the Indo-Pacific = De evolutionaire geschiedenis van parasitaire slakken en hun gastheer koralen in de Indo-Pacific. pp. 207-213 (2006)
- [6] Ph. Kerremans. Hierarchical CNN to identify Mollusca. IdentifyShell.org (2025)
- [7] Zhang, Q., Zhou, J., He, J. et al. A shell dataset, for shell features extraction and recognition.. Nature, Sci Data 6, 226 (2019)
- [8] Ph. Kerremans Identifying Shells using Convolutional Neural Networks: Data Collection and Model Selection. IdentifyShell.org (2024)
- [9] Collin, R. Development and anatomy of Nitidiscala tincta (Carpenter, 1865) (Gastropoda: Epitoniidae). The Veliger 43: 302–312 (2000)
- [10] Brown, L. G. & Neville, B. D. Catalog of the recent taxa of the families Epitoniidae and Nystiellidae (Mollusca: Gastropoda) with a bibliography of the descriptive and systematic literature. Zootaxa 3907: 1-188 (2015)
- [11] Gittenberger, A. The wentletrap Epitonium hartogi sp. nov. associated with bubble coral species Plerogyra spp.. Zoologische Verhandelingen 345 (2003)
- [12] Robertson, R. Wentletraps (Epitoniidae) feeding on sea anemones and corals.. Journal of Molluscan Studies 35: 51–63 (1963)
- [13] Kokshoorn, B., Gittenberger, A. & Gittenberger, E. Epitoniid parasites (Gastropoda, Caenogastropoda, Epitoniidae) and their host sea anemones in the Spermonde Archipelago, Indonesia. . Basteria 71 (2007)
- [14] Gittenberger, A. & Hoeksema, B. W. Habitat preferences of coral-associated wentletrap snails (Gastropoda: Epitoniidae). Contributions to Zoology 82: 1–25 (2013)
- [15] Mehrotra, R. et al. Parasites or predators? Gastropod ectoparasites and their scleractinian host corals at Koh Tao, Gulf of Thailand, with the description of a new species. Symbiosis (2024)
- [16] Beu, A. G. Evolution of Janthina and Recluzia (Mollusca: Gastropoda: Epitoniidae). Records of the Australian Museum 69 (3), 119-222 (2017)
- [17] Bouchet, P et al. Revised classification, nomenclator and typification of gastropod and monoplacophoran families. Malacologia 61: 1–526 (2017)
Supplement. Tables
Table S1: The Epitoniidae Dataset
| Family | # images | Species | # images |
|---|---|---|---|
| Amaea | 719 | A. africana | 50 |
| A. ferminiana | 104 | ||
| A. foulisi | 34 | ||
| A. gazeoides | 41 | ||
| A. magnifica | 122 | ||
| A. mitchelli | 115 | ||
| A. retifera | 53 | ||
| A. splendida | 166 | ||
| A. thielei | 34 | ||
| Cirsotrema | 1183 | C. bonum | 56 |
| C. dalli | 40 | ||
| C. edgari | 54 | ||
| C. magellanicum | 133 | ||
| C. pumiceum | 155 | ||
| C. rugosum | 85 | ||
| C. varicosum | 482 | ||
| C. zelebori | 148 | ||
| Epitonium | 4915 | E. alatum | 59 |
| E. albidum | 77 | ||
| E. angulatum | 244 | ||
| E. angulicinctum | 51 | ||
| E. aureomaculatum | 86 | ||
| E. celesti | 55 | ||
| E. clathratulum | 63 | ||
| E. clathrus | 319 | ||
| E. crassicostatum | 34 | ||
| E. cumingii | 48 | ||
| E. georgettinum | 124 | ||
| E. gradilis | 44 | ||
| E. grayi | 185 | ||
| E. humphreysii | 129 | ||
| E. indianorum | 42 | ||
| E. irregulare | 142 | ||
| E. jukesianum | 127 | ||
| E. laidlawi | 38 | ||
| E. liliputanum | 164 | ||
| E. lyra | 52 | ||
| E. multistriatum | 54 | ||
| E. novangliae | 59 | ||
| E. obtusum | 48 | ||
| E. occidentale | 64 | ||
| E. oppositum | 30 | ||
| E. pallasi | 135 | ||
| E. profundum | 59 | ||
| E. pyramidale | 227 | ||
| E. replicatum | 61 | ||
| E. robillardi | 25 | ||
| E. sakuraii | 36 | ||
| E. sandwichense | 57 | ||
| E. sawinae | 34 | ||
| E. scalare | 551 | ||
| E. simplex | 37 | ||
| E. stigmaticum | 136 | ||
| E. syoichiroi | 40 | ||
| E. tenellum | 61 | ||
| E. thrasys | 26 | ||
| E. tinctum | 53 | ||
| E. tokyoense | 189 | ||
| E. turtonis | 204 | ||
| Gyroscala | 793 | G. commutata | 445 |
| G. coronata | 160 | ||
| G. rupicola | 85 | ||
| G. statuminata | 103 | ||
| Janthina | 538 | J. exigua | 58 |
| J. globosa | 93 | ||
| J. janthina | 314 | ||
| J. pallida | 73 | ||
| Opalia | 636 | O. australis | 101 |
| O. bicarinata | 37 | ||
| O. crenata | 133 | ||
| O. funiculata | 116 | ||
| O. graciai | 47 | ||
| O. granosa | 44 | ||
| O. pumilio | 47 | ||
| O. wroblewskyi | 111 |
Table S2: The Amaea Dataset and Metrics
| Class | Images | Accuracy | Precision | Recall | F1 |
|---|---|---|---|---|---|
| africana | 50 | 0.963 | 0.929 | 1.000 | 0.963 |
| ferminiana | 104 | 1.000 | 1.000 | 1.000 | 1.000 |
| foulisi | 34 | 0.909 | 1.000 | 0.833 | 0.909 |
| gazeoides | 41 | 0.444 | 0.400 | 0.500 | 0.444 |
| magnifica | 122 | 1.000 | 1.000 | 1.000 | 1.000 |
| mitchelli | 115 | 0.976 | 1.000 | 0.952 | 0.976 |
| retifera | 53 | 0.966 | 1.000 | 0.933 | 0.966 |
| splendida | 166 | 0.928 | 0.941 | 0.914 | 0.928 |
| thielei | 34 | 0.875 | 0.778 | 1.000 | 0.875 |
| Summary metrics | - | Train acc: 0.950 Val acc: 0.951 |
Macro precision: 0.894 | Weighted recall: 0.931 | Weighted F1: 0.932 |
Table S3: The Cirsotrema dataset composition and class-level performance metrics
| Class | Images | Accuracy | Precision | Recall | F1 |
|---|---|---|---|---|---|
| bonum | 56 | 1.000 | 1.000 | 1.000 | 1.000 |
| dalli | 40 | 1.000 | 1.000 | 1.000 | 1.000 |
| edgari | 54 | 0.968 | 1.000 | 0.938 | 0.968 |
| magellanicum | 133 | 0.980 | 1.000 | 0.960 | 0.980 |
| pumiceum | 155 | 0.988 | 0.976 | 1.000 | 0.988 |
| rugosum | 85 | 0.957 | 0.917 | 1.000 | 0.957 |
| varicosum | 482 | 0.995 | 1.000 | 0.989 | 0.995 |
| zelebori | 148 | 0.983 | 0.967 | 1.000 | 0.983 |
| Summary metrics | - | Train acc: 0.983 Val acc: 0.970 |
Macro precision: 0.982 | Weighted recall: 0.988 | Weighted F1: 0.987 |
Table S4: The Epitonium dataset composition and class-level performance metrics
| Class | Images | Accuracy | Precision | Recall | F1 |
|---|---|---|---|---|---|
| alatum | 59 | 0.640 | 0.615 | 0.667 | 0.640 |
| albidum | 77 | 0.778 | 0.824 | 0.737 | 0.778 |
| angulatum | 244 | 0.939 | 0.920 | 0.958 | 0.939 |
| angulicinctum | 51 | 1.000 | 1.000 | 1.000 | 1.000 |
| aureomaculatum | 86 | 0.963 | 1.000 | 0.929 | 0.963 |
| celesti | 55 | 1.000 | 1.000 | 1.000 | 1.000 |
| clathratulum | 63 | 0.710 | 0.647 | 0.786 | 0.710 |
| clathrus | 319 | 0.947 | 0.964 | 0.931 | 0.947 |
| crassicostatum | 34 | 0.800 | 0.667 | 1.000 | 0.800 |
| cumingii | 48 | 0.778 | 0.636 | 1.000 | 0.778 |
| georgettinum | 124 | 0.920 | 0.920 | 0.920 | 0.920 |
| gradilis | 44 | 0.833 | 1.000 | 0.714 | 0.833 |
| grayi | 185 | 0.844 | 0.871 | 0.818 | 0.844 |
| humphreysii | 129 | 0.826 | 0.905 | 0.760 | 0.826 |
| indianorum | 42 | 0.762 | 0.727 | 0.800 | 0.762 |
| irregulare | 142 | 0.800 | 0.800 | 0.800 | 0.800 |
| jukesianum | 127 | 0.698 | 0.789 | 0.625 | 0.698 |
| laidlawi | 38 | 0.737 | 0.583 | 1.000 | 0.737 |
| liliputanum | 164 | 0.840 | 0.872 | 0.810 | 0.840 |
| lyra | 52 | 1.000 | 1.000 | 1.000 | 1.000 |
| multistriatum | 54 | 0.800 | 0.714 | 0.909 | 0.800 |
| novangliae | 59 | 0.857 | 0.750 | 1.000 | 0.857 |
| obtusum | 48 | 0.900 | 0.818 | 1.000 | 0.900 |
| occidentale | 64 | 0.727 | 0.667 | 0.800 | 0.727 |
| oppositum | 30 | 1.000 | 1.000 | 1.000 | 1.000 |
| pallasi | 135 | 0.833 | 0.893 | 0.781 | 0.833 |
| profundum | 59 | 0.667 | 0.727 | 0.615 | 0.667 |
| pyramidale | 227 | 0.874 | 0.905 | 0.844 | 0.874 |
| replicatum | 61 | 0.815 | 0.846 | 0.786 | 0.815 |
| robillardi | 25 | 0.824 | 0.700 | 1.000 | 0.824 |
| sakuraii | 36 | 0.897 | 0.867 | 0.929 | 0.897 |
| sandwichense | 57 | 0.786 | 0.688 | 0.917 | 0.786 |
| sawinae | 34 | 0.933 | 1.000 | 0.875 | 0.933 |
| scalare | 551 | 0.974 | 0.983 | 0.966 | 0.974 |
| simplex | 37 | 0.750 | 0.750 | 0.750 | 0.750 |
| stigmaticum | 136 | 0.921 | 0.935 | 0.906 | 0.921 |
| syoichiroi | 40 | 0.421 | 0.400 | 0.444 | 0.421 |
| tenellum | 61 | 0.846 | 0.846 | 0.846 | 0.846 |
| thrasys | 26 | 1.000 | 1.000 | 1.000 | 1.000 |
| tinctum | 53 | 0.857 | 0.818 | 0.900 | 0.857 |
| tokyoense | 189 | 0.738 | 0.727 | 0.750 | 0.738 |
| turtonis | 204 | 0.925 | 0.974 | 0.881 | 0.925 |
| Summary metrics | - | Train acc: 0.900 Val acc: 0.864 |
Macro precision: 0.827 | Weighted recall: 0.866 | Weighted F1: 0.865 |
Table S5: The Gyroscala dataset composition and class-level performance metrics
| Class | Images | Accuracy | Precision | Recall | F1 |
|---|---|---|---|---|---|
| commutata | 445 | 0.971 | 0.976 | 0.965 | 0.971 |
| coronata | 160 | 0.938 | 0.927 | 0.950 | 0.938 |
| rupicola | 85 | 1.000 | 1.000 | 1.000 | 1.000 |
| statuminata | 103 | 1.000 | 1.000 | 1.000 | 1.000 |
| Summary metrics | - | Train acc: 0.978 Val acc: 0.968 |
Macro precision: 0.976 | Weighted recall: 0.970 | Weighted F1: 0.971 |
Table S6: The Janthina dataset composition and class-level performance metrics
| Class | Images | Accuracy | Precision | Recall | F1 |
|---|---|---|---|---|---|
| exigua | 58 | 0.933 | 1.000 | 0.875 | 0.933 |
| globosa | 93 | 0.919 | 0.944 | 0.895 | 0.919 |
| janthina | 314 | 0.978 | 0.958 | 1.000 | 0.978 |
| pallida | 73 | 0.957 | 1.000 | 0.917 | 0.957 |
| Summary metrics | - | Train acc: 0.995 Val acc: 0.953 |
Macro precision: 0.976 | Weighted recall: 0.957 | Weighted F1: 0.960 |
Table S7: The Opalia dataset composition and class-level performance metrics
| Class | Images | Accuracy | Precision | Recall | F1 |
|---|---|---|---|---|---|
| australis | 101 | 1.000 | 1.000 | 1.000 | 1.000 |
| bicarinata | 37 | 0.818 | 0.750 | 0.900 | 0.818 |
| crenata | 133 | 0.979 | 1.000 | 0.958 | 0.979 |
| funiculata | 116 | 0.955 | 0.913 | 1.000 | 0.955 |
| garciai | 47 | 0.947 | 0.900 | 1.000 | 0.947 |
| granosa | 44 | 0.960 | 1.000 | 0.923 | 0.960 |
| pumilio | 47 | 0.857 | 1.000 | 0.750 | 0.857 |
| wroblewskyi | 111 | 0.941 | 0.941 | 0.941 | 0.941 |
| Summary metrics | - | Train acc: 0.974 Val acc: 0.945 |
Macro precision: 0.938 | Weighted recall: 0.951 | Weighted F1: 0.949 |
Table S8: Pearson and Spearman correlations between task-complexity descriptors and model performance across the six genera
| Predictor | Pearson r with validation accuracy |
Spearman ρ with validation accuracy |
Pearson r with weighted F1 |
Spearman ρ with weighted F1 |
Pearson r with macro precision |
Spearman ρ with macro precision |
|---|---|---|---|---|---|---|
| Number of classes | -0.968 | -0.647 | -0.914 | -0.736 | -0.883 | -0.746 |
| Total images | -0.929 | -0.029 | -0.847 | -0.086 | -0.804 | -0.174 |
| Images per class | 0.425 | 0.771 | 0.520 | 0.714 | 0.605 | 0.667 |
| Imbalance ratio (max/min) | -0.802 | 0.086 | -0.678 | 0.029 | -0.649 | 0.058 |